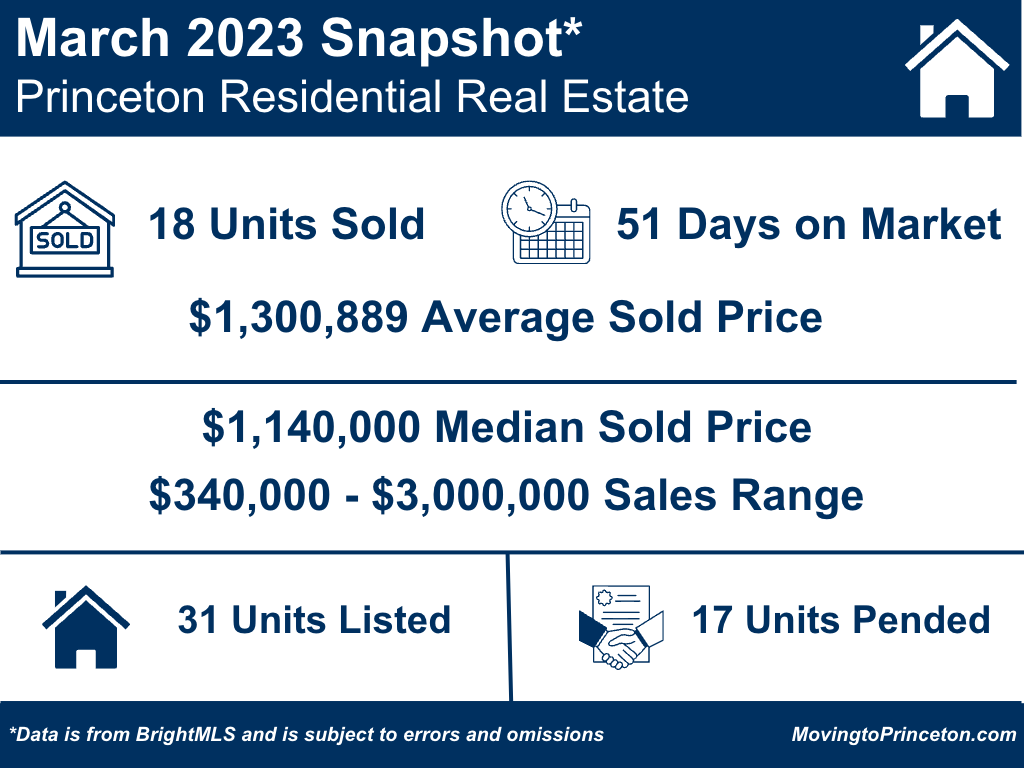
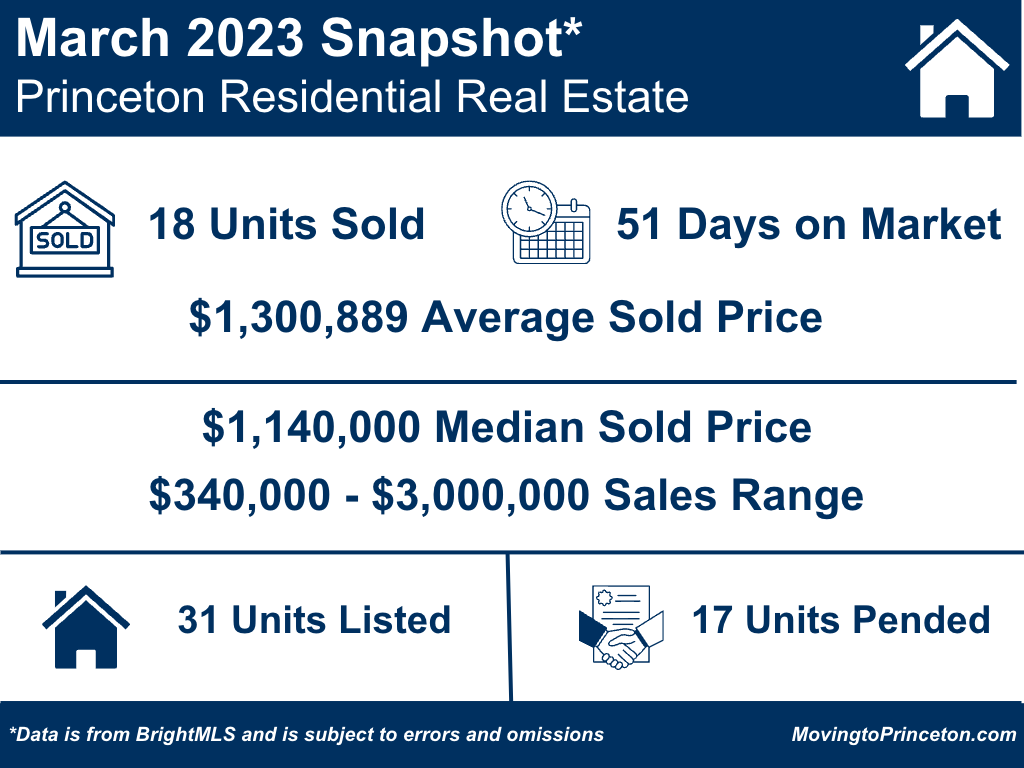
Like last month, the March 2023 sales data continues to show that we are in a transitioning market and that we need new inventory. As you will see, the year-over-year (YOY) sales reflect the lack of new listings and we can’t help but wonder where we would be if there was more inventory to sell.
So what happened in March 2023? Units Sold (-22%), Units Pended (-29%), Units Listed (-34%), and Days on Market (-9%) all experienced a decrease compared to March 2022. The Average Sale Price (+16%) and the Median Sale Price (+24%) both increased in versus March 2022. In other words, because there were fewer new listings, there were fewer houses sold and fewer properties to go under contract. The houses that did trade sold at a higher price compared to the same period last year.
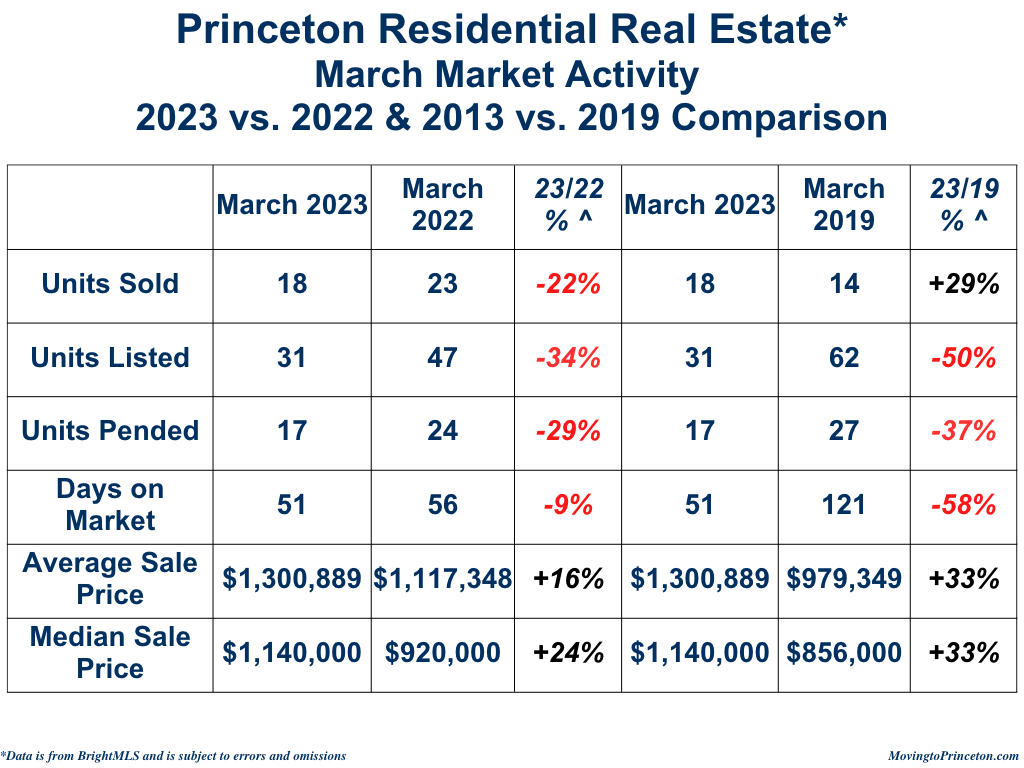
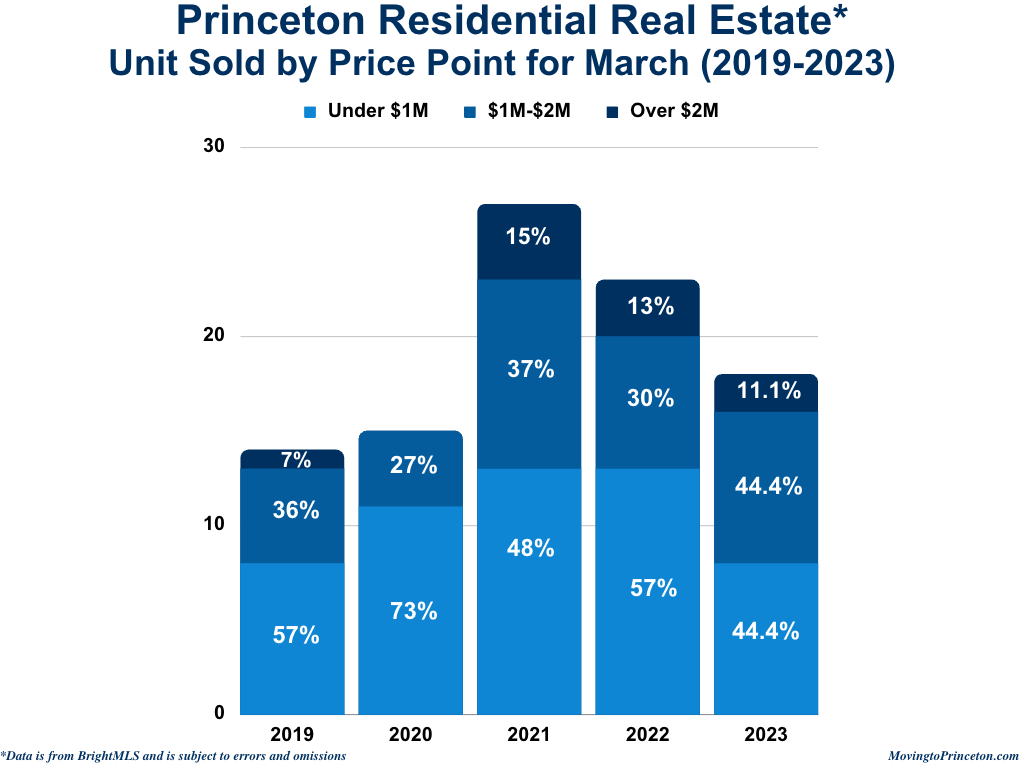
Now let’s look at March 2023 versus March 2019. In March 2023, there was a 4 unit increase in Units Sold (+29%) and decreases across the board in Units Listed (-50%), Units Pended (-37%), and the Days On Market (-58%) compared to March 2022. The Average Sale Price (ASP) and Median Sale Price (MSP) both experienced the same increase (+33%). Curious about the years in-between? The bar chart below shows Units Sold, Units Listed, Units Pended, and the Days on Market (DOM) over the last 5 years. The Units Sold and Units Pended numbers are pretty astounding given how few Units Listed were in March 2023 compared to prior years.

Now let’s take a deeper dive into the March 2023 ASP and MSP to understand sales composition relative to last year. In March 2023 the highest sale was $3,000,000 versus $2,295,000 in March 2022. Additionally, there was a higher penetration of sales (44.4% vs. 30%) in the $1M-$2M price range in March 2023 compared to March 2022, when 57% of the sales were below $1M. Given the aforementioned information, it’s not surprising that there was a such remarkable YOY increase in both the ASP (+16%) and the MSP (+24%).
How is Princeton performing year-to-date (YTD)? Units Sold (-45%), Units Listed (-22%), and DOM (-8%) all decreased compared to January-March 2022. As for January-March 2023 versus January-March 2019, there was a 2 unit increase (+6%) in Units Sold, but a 50 unit decrease (-40%) in Units Listed and a -48% decrease in DOM (46 days). Again, it’s pretty remarkable that YTD more properties sold faster with considerably less inventory than in the same period in 2022.

As for the ASP and MSP, the January-March 2023 ASP (+24%) and MSP (+29%) increased compared to January-March 2022. Relative to January-March 2019, the January-March 2023 ASP and MSP increased +38% and +36% respectively. March 2023 experienced the highest sale in 5 years ($3,000,000), and the highest penetration in $1M-$2M sales (44.4%).

So what does this all mean? We are now starting to return to pre-pandemic levels of Units Sold, but are well below the number of Units Listed in previous years. Additionally, while we are still seeing properties sell fairly quickly, opportunities for buyers are starting to emerge. And with the holiday and spring break season behind us, it will be interesting to see what the next few weeks will bring.
So what is happening now? There are currently 59 Active Units between $439,000 and $5,000,000, 25 Active Under Contract Units between $600,000 and $12,000,000, and 16 Pending Units between $420,000 and $2,600,000 in Princeton. Lastly, 14 properties were introduced thus far in April between $439,000 and $4,250,000 and all of them are still Active.
If you have been thinking about selling your house but have been on the fence, now may be the time to list. There are buyers – both local and out-of-town – looking to purchase a home and it would be an honor to provide a competitive market analysis for your property.
As always, if you are thinking about buying or selling your home or want to learn more about Princeton area real estate market statistics, feel free to email us! Sig & Syl

Leave a comment