

Last year was another interesting year for the Princeton residential real estate market. The beginning of 2022 was filled with multiple bids, quick sales, and fewer listings. A property would be introduced on Thursday and under contract by the following Tuesday. Sometime in the mid-to-late second quarter, a shift occurred. The market changed from the sellers seemingly having all the leverage and offering houses “as-is”, to a place where buyers were less inclined to take on all inspection issues. There were still multiple offers, but not as many as in the beginning of the year. Macro factors such as increased interest rates, higher inflation, and geopolitical risks likely contributed to this change. As the year went on, micro factors, such as lack of inventory and buyer demand, continued to move the market in ways that weren’t necessarily in tandem with national real estate headlines; further proving the hyperlocal nature of real estate. Because our area did not experience the wild increases that other parts of the country did over the last few years, we also did not see enormous decreases in market activity or pricing.
Now let’s take a look at the data. As always, it is important to note that there are several sales that take place outside BrightMLS, often in the high-end, and this information is not captured in this analysis. In 2022, Units Sold (299 vs. 369) and Units Listed (362 vs. 446) both experienced a -19% decrease compared to 2021. Given there were fewer properties to sell, it’s no wonder that there was a material reduction in the Days on Market (-26%, 35 vs. 47). Yes, you read that correctly – the average number of days a property was on the market in 2022 was only 35 days. When you compare 2022 to 2019, a pre-pandemic year. Units Sold experienced a slight increase (+3%, 299 vs. 291) with fewer Units Listed (-19%, 362 vs. 448), while selling at a significantly faster rate (DOM -53%, 35 vs. 75) compared to 2019.
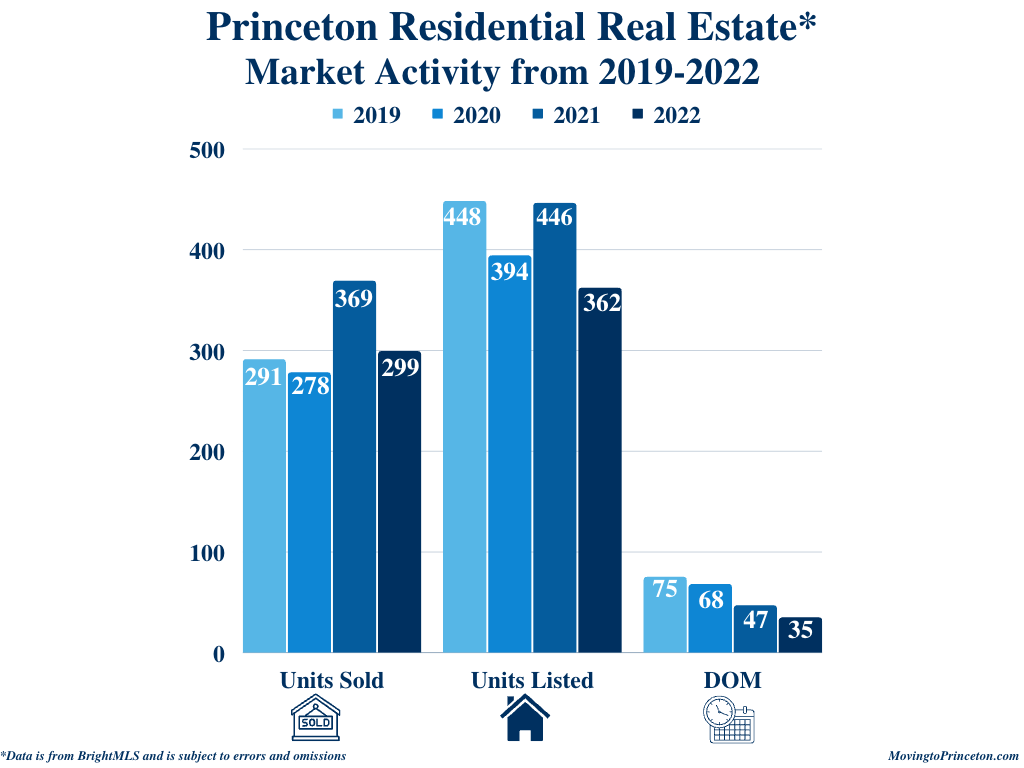
Now let’s look at the activity by month in 2022. June (36), August (33), and July (31) saw the most Units Sold, while April (48), March (47), and June (42) had the highest Units Listed. June (15) was the month with the fewest Days on Market, followed by May (22), and July and August were tied (26) for third. There was a similar cadence to Units Sold in 2021 with June (44), July (43) and August (42) experiencing the most sales. Units Listed was slightly different in 2021 with June (71), April (54), and May (51) having the highest listings. In 2019, Units Sold was about the same as 2022 with August (41), June (38), and July (38) leading the pack, the variance was in Units Listed with most occurring in April (83), March (62), and May (57).

How did the Average and Median Sale Prices in 2022 compare to 2021? The 2022 Average Sale Price (ASP) was up +8% ($1,265,876 vs. $1,169,479) and the Median Sale Price (MSP) increased +14% ($1,136,500 vs. $999,990). When you compare 2022 to 2019, the 2022 ASP was up +24% ($1,265,876 vs. $1,136,500) and the MSP increased +26% ($1,136,500 vs. 901,000).

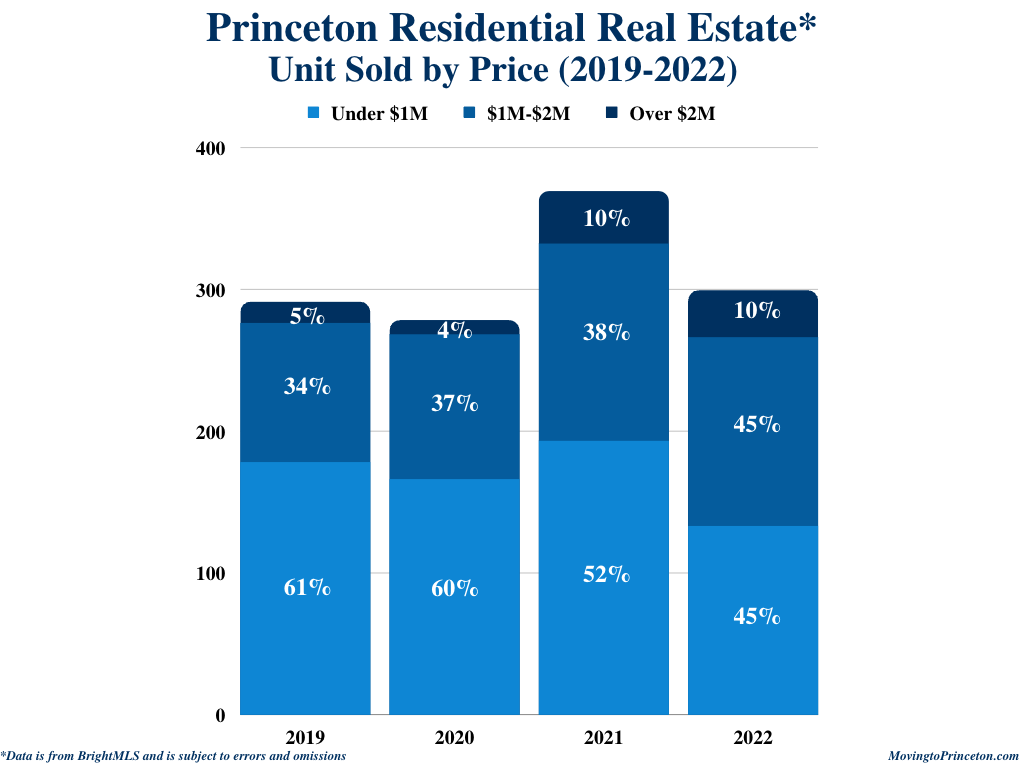
Now let’s take a deeper dive in to the Units Sold composition. As noted by the chart below, before 2022 the majority of sales occurred in the Under $1M price point. Last year, sales were evenly distributed between Under $1M and $1M-$2M price ranges.
What is happening now in Princeton? There are currently 36 Active listings between $340,000 and $3,850,000, 9 properties that are Active Under Contract between $639,000-$12,000,000, and 10 Pending listings between $899,000-$3,199,950. Thus far in 2023, there have been two closings and one new listings introduced.
What will 2023 bring? While we wish we had the proverbial crystal ball, our sense is that buyer demand will continue and 2023 will be another active and more balanced year for the Princeton residential real estate. All that being said, sweeping generalizations cannot be made about our market. Properties in certain price points, locations, and conditions can behave differently from a statistical standpoint. As pricing a house is not an exact science and other factors often come into play, it is helpful to understand local market trends. Speaking of markets, if you are thinking about buying or selling your home or want to learn more about Princeton area real estate market statistics, feel free to email us! Sig & Syl
