
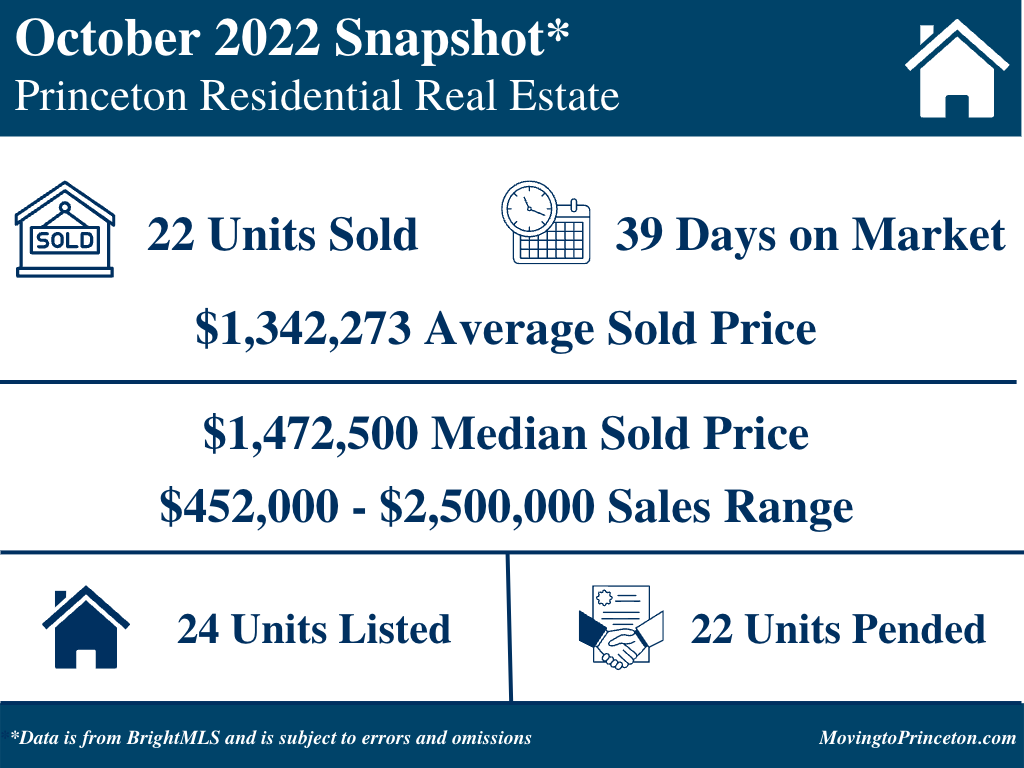
Like last month, the October 2022 data is going to look a bit wonky compared to October 2021. The Average Sold Price (+24%) and the Median Sale Price (+55%) both experienced material increases. Units Sold (-15%), Units Listed (-4%), Units Pended (-38%), and Days on Market (-7%) all decreased compared to October 2021. In other words, fewer properties sold faster and at higher prices with less inventory in October 2022 than in October 2021.
Also like last month, we thought it would be helpful to share the last 4 years worth of data in order to include the last pre-pandemic year for better context and a richer analysis.
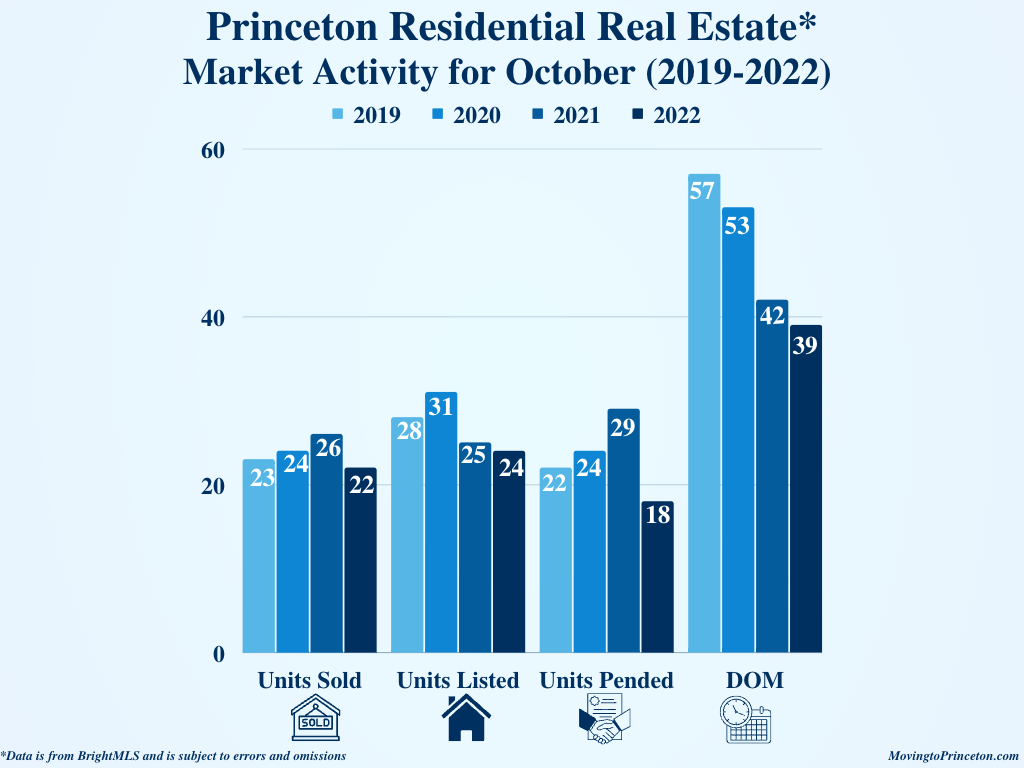
Much like the prior comparison, in October 2022 there were also fewer Units Sold (-4%), Units Listed (-14%), Units Pended (-18%), and Days on Market (-32%) than in October 2019. In fact, October 2022 experienced the fewest Units Sold, Units Listed, Units Pended, and DOM in the last four years.
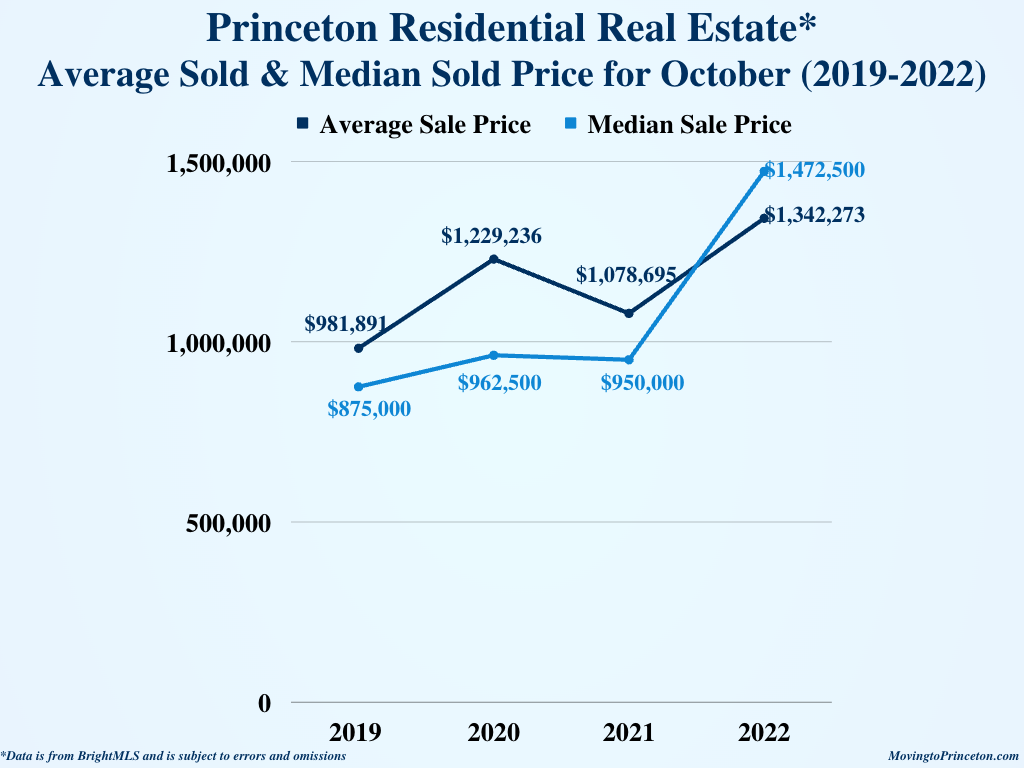
Now let’s look at both the Average Sold Price (ASP) and Median Sold Price (MSP). The October 2022 ASP (+24%) and MSP (+55%) were remarkably higher compared to October 2021. When looking at October 2022 versus October 2019, both the ASP (+37%) and the MSP also significantly increased (+68%).
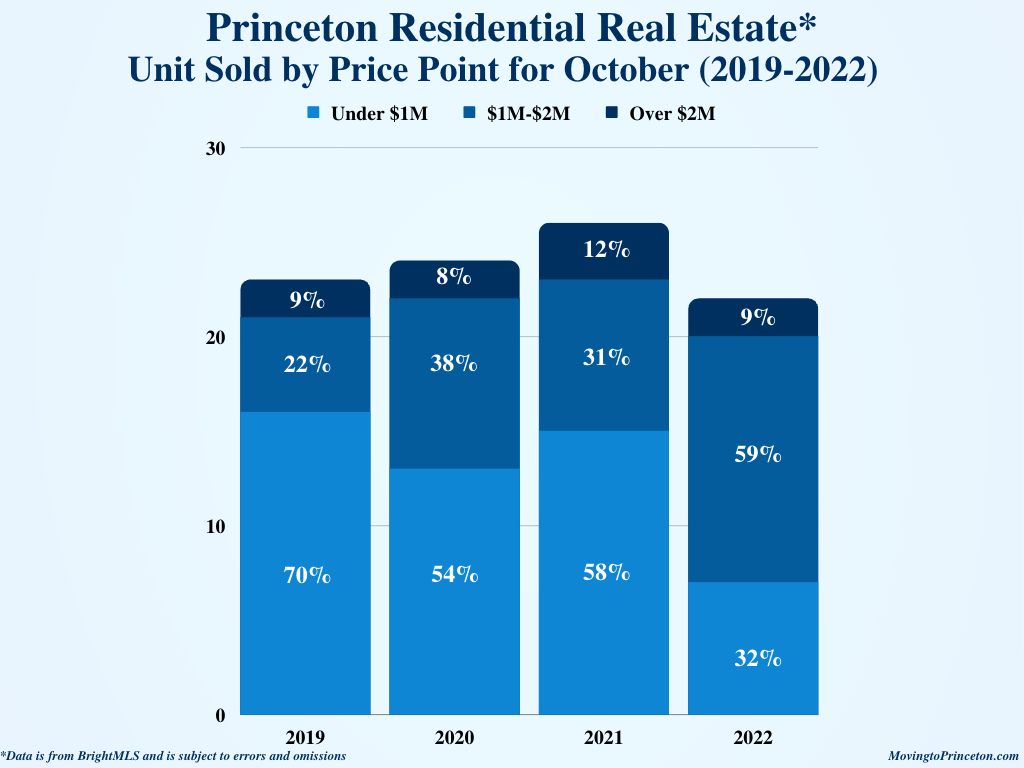
What might be causing such considerable increases in the October 2022 ASP and the MSP? As noted by the chart below, the sales composition was completely different than in prior years with most of the sales occurring in the in the $1M-$2M price range. As always, it is important to note that there are several sales that take place outside BrightMLS and are not captured in this data.
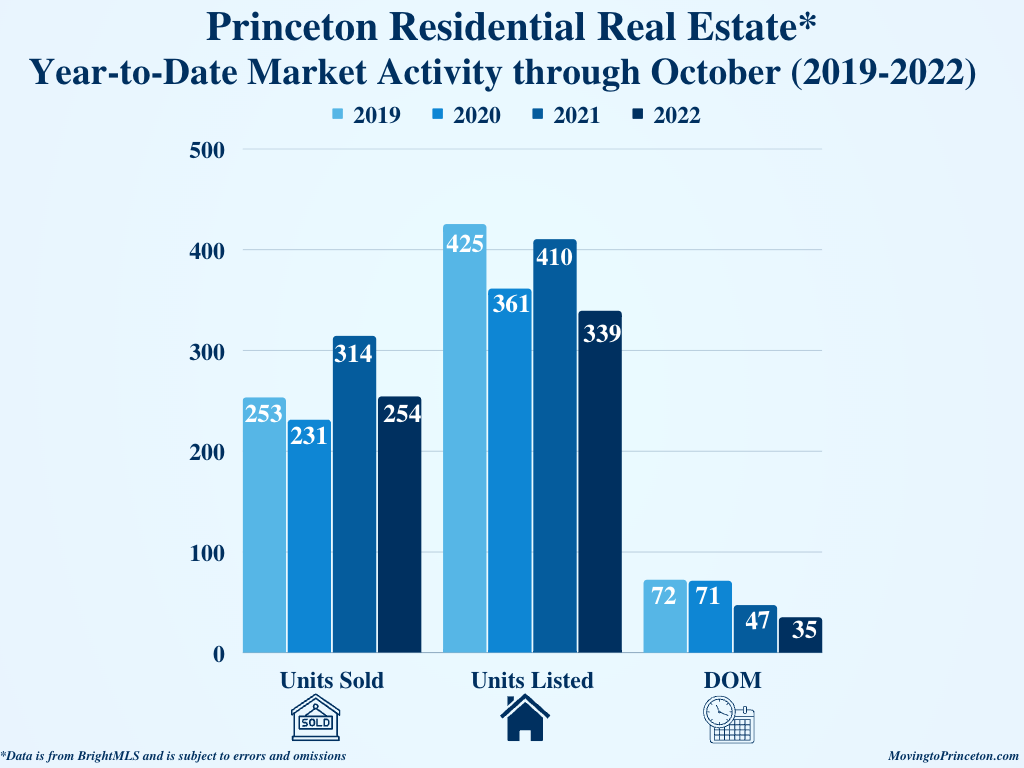
How is Princeton performing year-to-date (YTD)? Units Closed (-19%), Units Listed (-17%), and DOM (-26%) all decreased compared to January-October 2021. As for January-October 2022 versus January-October 2019, Units Closed were effectively flat (254 vs. 253), while Units Listed (-20%) and DOM (-51%) experienced decreases compared to the same period in 2019.
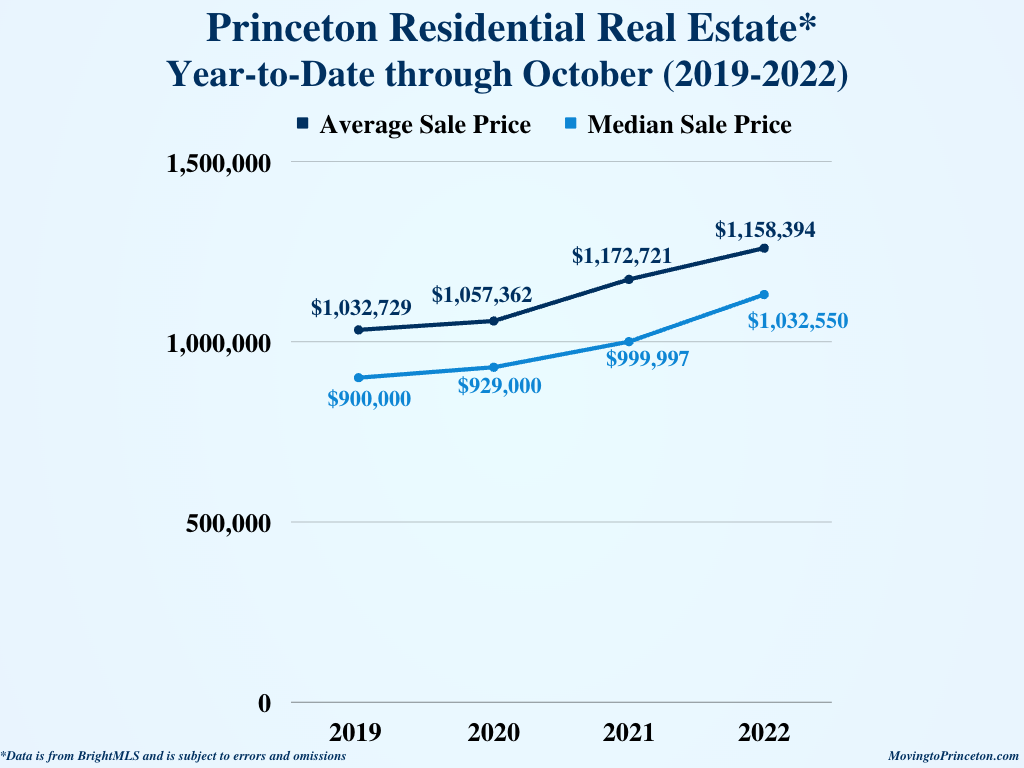
The YTD 2022 ASP and MSP both increased greatly compared to the same period in 2021 and in 2019, with higher rates of increase when looking at 2022 versus 2019 (ASP +22% and MSP +26%).
What does this all mean? While we are now starting to return to pre-pandemic levels of Units Sold, we are well below the number of Units Listed in previous years. As such, properties that do come on the market are selling quicker and at higher prices.
So what is happening now? There are currently 58 Active Units between $310,000 and $4,999,000, 17 Active Under Contract Units between $735,500 and $12,000,000, and 20 Pending Units between $675,000 and $3,199,500 in Princeton. Lastly, 11 properties were introduced thus far in November.
As always, if you are thinking about buying or selling your home or want to learn more about Princeton area real estate market statistics, free to email us! Sig & Syl
