
Happy 2017! A new year brings a sense of hope and renewal. Resolutions are made and the New Year gives us the opportunity to regroup and reset. Personally, we are looking forward to a happy, healthy, and productive 2017. Before we look ahead, let’s review the 2016 Princeton residential real estate market.
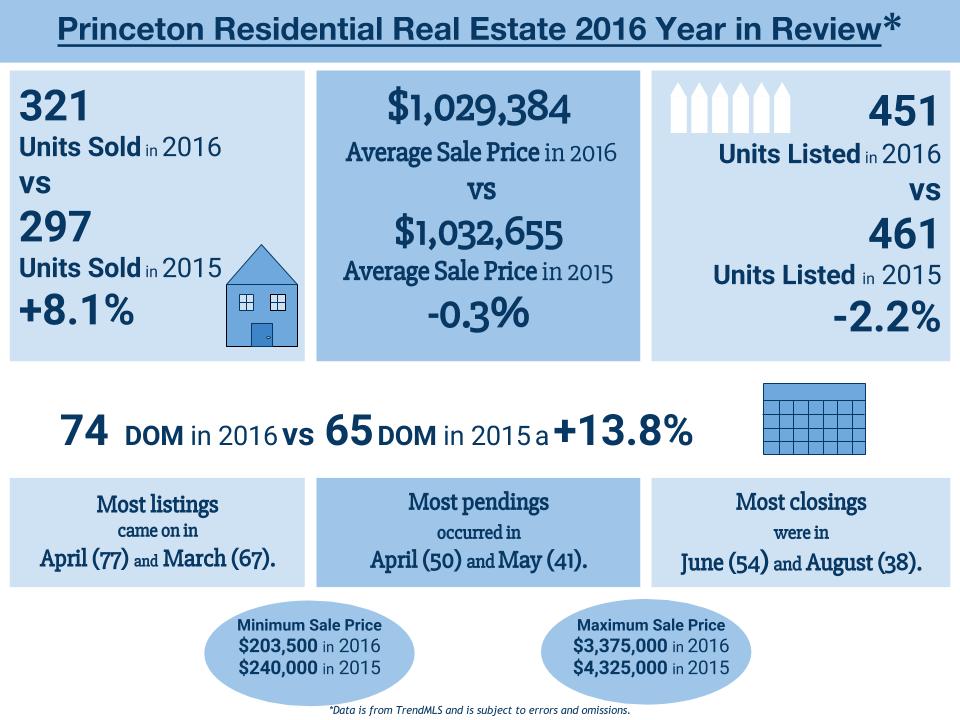
Compared to 2015, the Average Sale Price (ASP) was essentially flat (-0.3%) and the number of Units Sold increased (+8.1%). The number of Units Listed decreased (-2.2%) while the Days on Market increased (+13.8%). Now let’s dive a little deeper. Over 59% of Units Sold were at or below $1M vs 64% in 2014. In the higher price ranges, 22 additional units sold in the $1M-$2M range (111 vs 89) and the +$2M range was flat (19 vs 19) to last year. Overall the market saw an increase in penetration of Units Sold over $1M (40% v 36%).
In summary, 2016 was an active year when Units Solds surpassed the most recent high reached in 2014 (312) and the Average Sale Price continues to maintain a record level similar to 2008 ($1,016,38). That being said, sweeping generalizations cannot be made about our market. Certain price points, locations, and more recently updated houses behave differently from a statistical standpoint. And while pricing a home is not an exact science and other factors often come into play, it is helpful to understand market trends. Speaking of markets, if you are thinking about buying or selling your home or want to learn more about Princeton area real estate market statistics, feel free to email us! Happy New Year! Sig & Syl

Leave a comment