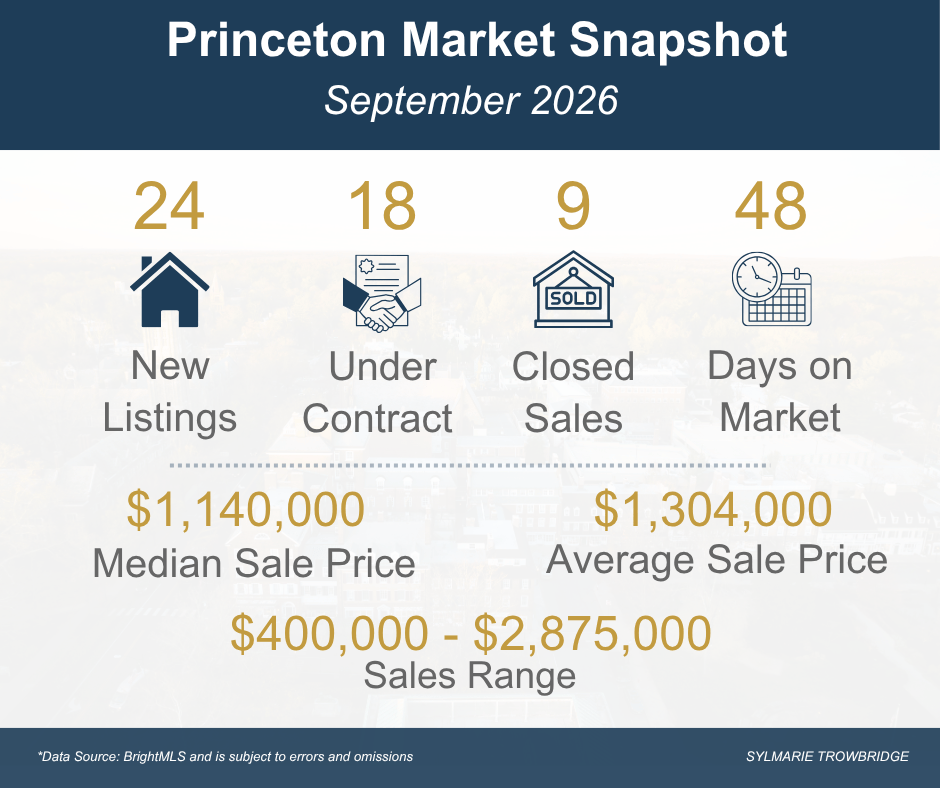
September presented a somewhat mixed picture for Princeton real estate. Fewer homes were listed and considerably fewer sales closed than during the same month last year. At the same time, under-contract activity increased and average days on market declined slightly.
While the numbers are mixed, they suggest that lower transaction volume does not necessarily translate into weaker buyer demand or declining values.
As always, it is important to note that a meaningful number of Princeton transactions occur outside of BrightMLS, particularly within the luxury market. Because these off-market sales are not reflected in the data below, the statistics provide an important snapshot of market activity, but they do not represent every transaction taking place. In addition, BrightMLS made changes earlier this year to the way it reports new listing activity, so some of the comparisons with prior periods may look a little wonky.
As a reminder, I continue to use 2019 as a pre-pandemic baseline alongside the most recent three years of data. I believe this provides helpful context for understanding how much the Princeton market has evolved.
Now, let’s take a closer look at the data.
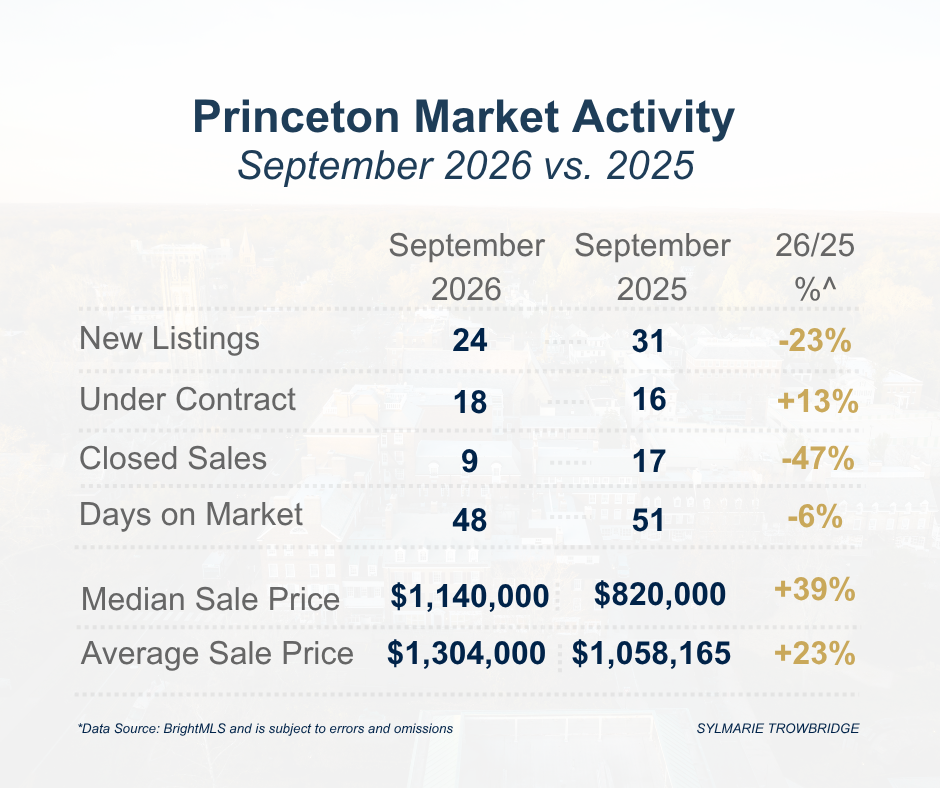
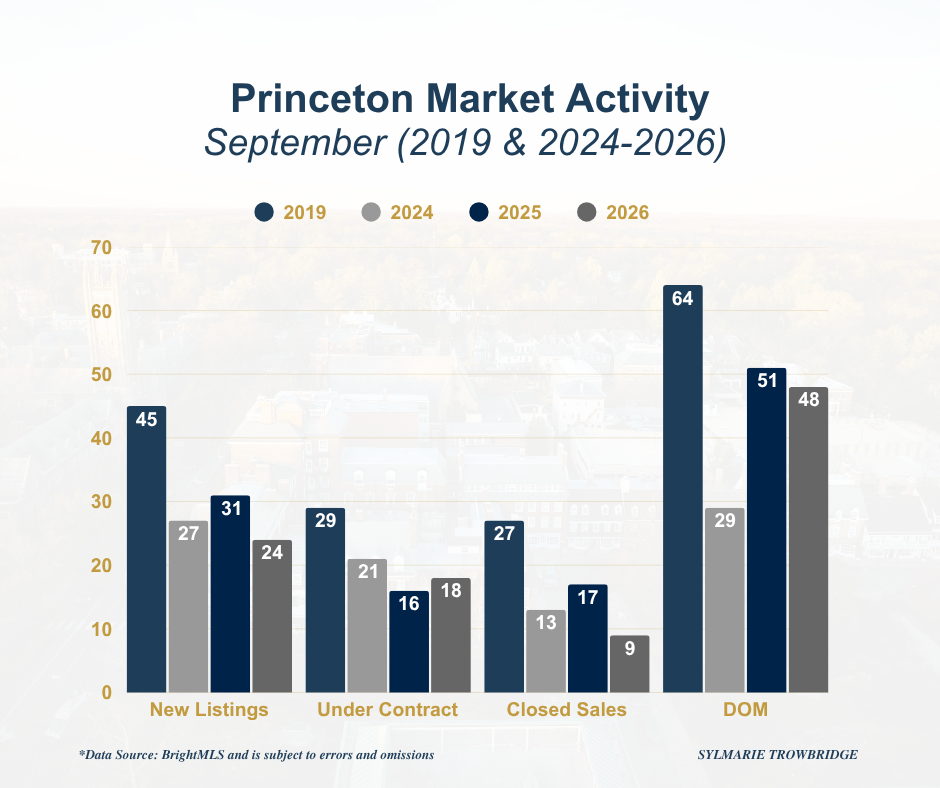
Twenty-four new listings came to market in September, compared with 31 during the same month last year. Under-contract activity moved in the opposite direction, with 18 homes going under contract compared with 16 in September 2025, an increase of 13%. Only nine sales closed during the month, down from 17 last September.
While the decline in closed sales is notable, closings generally reflect contracts negotiated several weeks earlier. For that reason, I find September’s increase in contracts particularly interesting. Despite 23% fewer new listings coming to market, 13% more homes went under contract than last September, suggesting that buyers remained engaged even with fewer homes available.
Average days on market also improved slightly, declining from 51 days in September 2025 to 48 days this year. While homes are taking longer to sell than they did in September 2024, when the average was just 29 days, they are still selling considerably faster than in September 2019, when the average was 64 days.
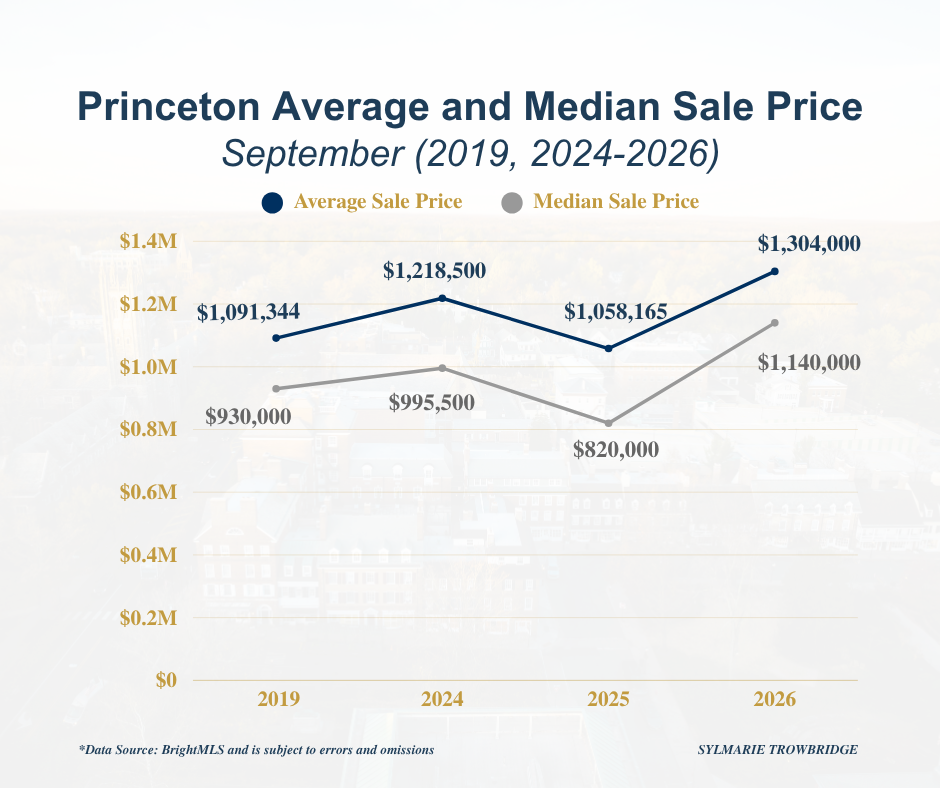
Pricing was strong in September. The median sale price increased to $1,140,000 from $820,000 in September 2025, while the average sale price increased to $1,304,000 from $1,058,165.
However, with only nine reported closings during the month, I think it is particularly important to look at what actually sold before drawing conclusions from those increases.
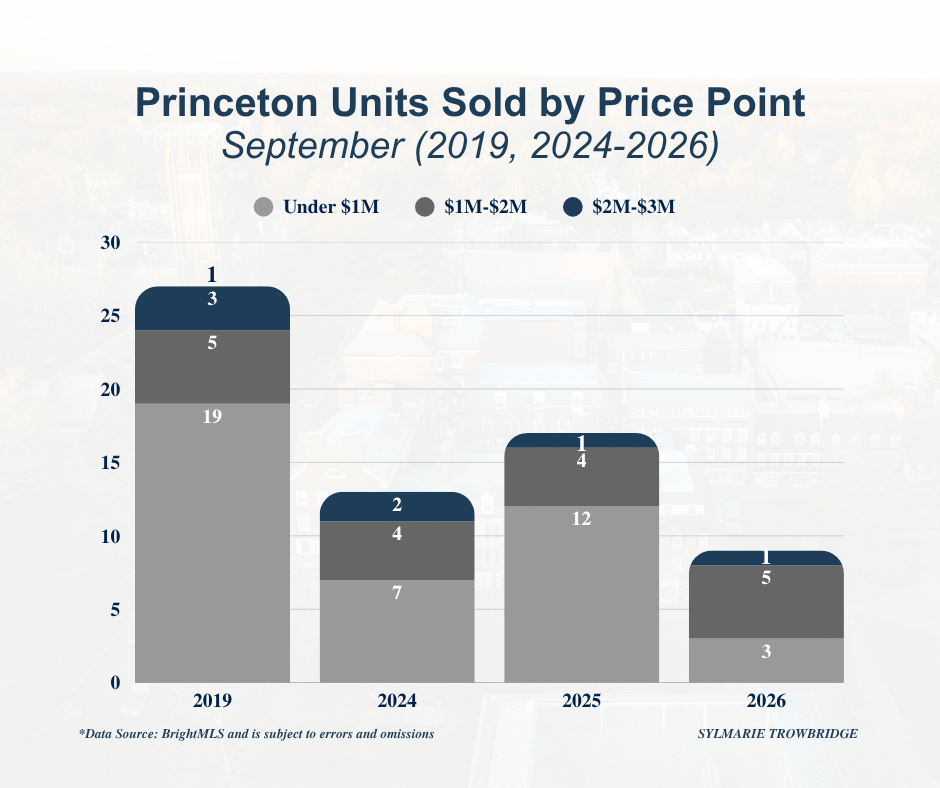
In September, just 33% of reported sales were below $1 million, compared with 71% in September 2025. Meanwhile, 56% of sales were between $1 million and $2 million, compared with 24% last September.
This shift toward higher-priced sales helps explain the substantial increase in September’s average and median prices. It is also a good example of why monthly pricing statistics, particularly in a relatively small market like Princeton, should be viewed in context rather than interpreted as a direct measure of changes in individual home values.
Year-to-Date Trends
With nine months of data now available, the year-to-date numbers provide a broader perspective.
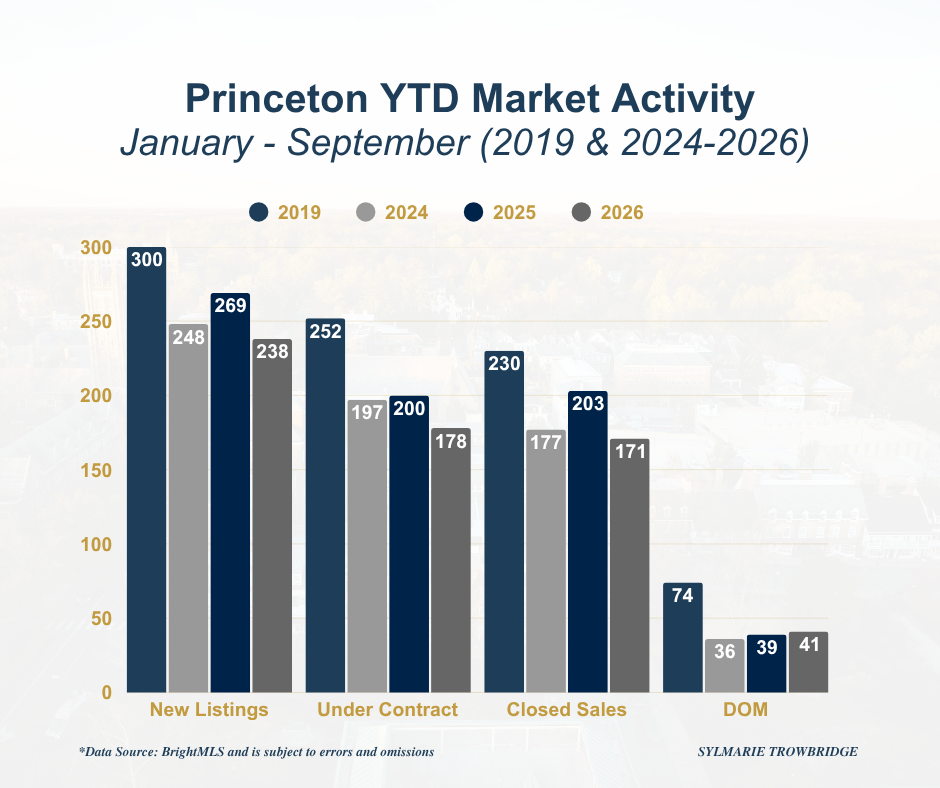
Through September, BrightMLS recorded 238 new listings, approximately 12% fewer than the 269 recorded during the same period last year. Under-contract activity totaled 178, down 11% from 200, while 171 sales closed, approximately 16% fewer than the 203 recorded in 2025.
While we cannot attribute lower transaction volume to any single factor, the similar declines in new listings and under-contract activity suggest that limited inventory continues to play an important role. With fewer homes coming to market, buyers have fewer opportunities to purchase, which ultimately limits the number of transactions that can occur.
Year-to-date average days on market is 41 days, compared with 39 days in 2025, but remains well below the 74-day average recorded during the same period in 2019.
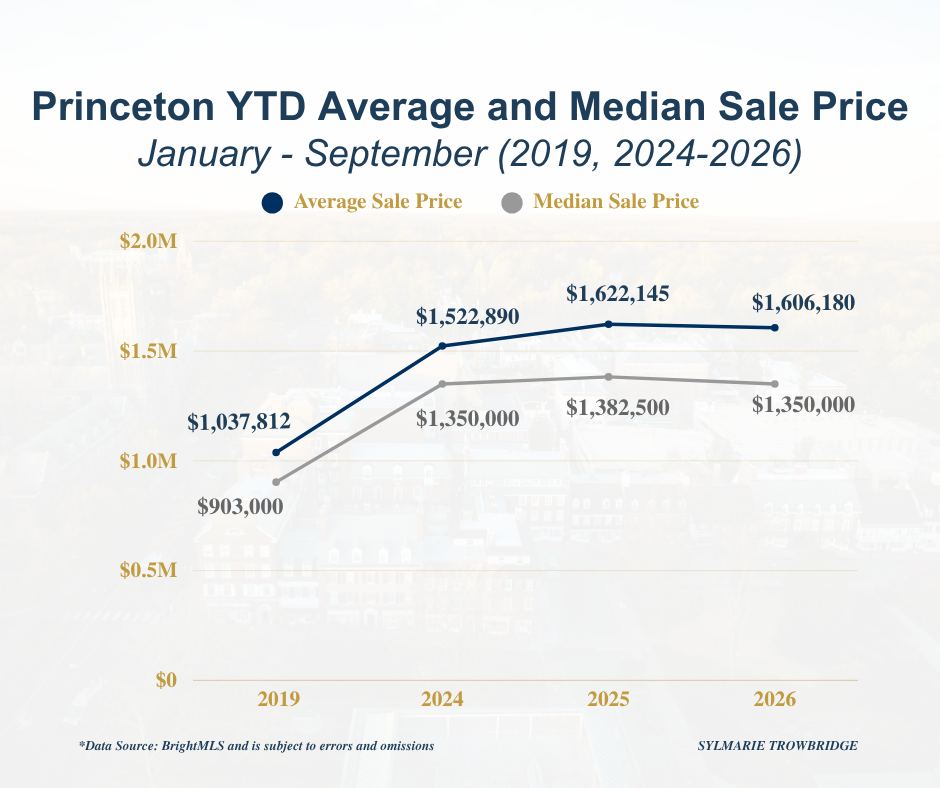
Pricing through the first nine months of the year provides an important counterpoint to September’s sharp monthly increases.
Through September, Princeton’s average sale price is $1,606,180, compared with $1,622,145 during the same period last year, a difference of approximately 1%. The median sale price is $1,350,000, compared with $1,382,500 in 2025, approximately 2% lower.
Both measures remain substantially above pre-pandemic levels. In 2019, the average sale price through September was $1,037,812 and the median was $903,000.
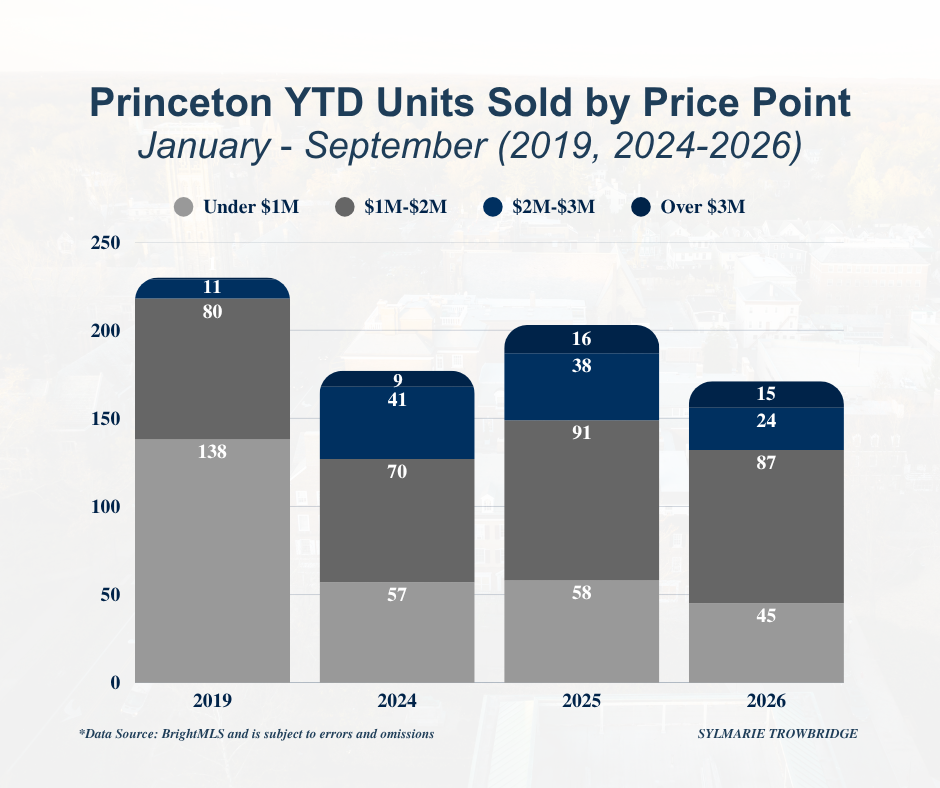
The mix of homes sold also provides useful context. Approximately 23% of reported sales through September were above $2 million, compared with approximately 27% during the same period last year. Most of that difference occurred in the $2 million to $3 million range, while activity above $3 million was nearly unchanged.
This difference in the mix of properties sold likely contributed to the modest decline in average and median prices and is another reason to look beyond the headline numbers when evaluating the market.
What This Means for Buyers
Limited inventory can still mean competition for desirable properties. September saw fewer homes come to market but more go under contract than a year ago, reinforcing the importance of being prepared when the right property becomes available.
At the same time, not every property is experiencing the same level of demand. Buyers may find opportunities with homes that have been on the market longer or have experienced a price adjustment. The appropriate strategy will continue to depend on the individual property, price point, condition, and level of competition.
What This Means for Sellers
Buyers remain active, but they are not responding equally to every property. Limited inventory alone does not guarantee a quick sale or premium result. Preparation, strategic pricing, presentation, and marketing remain important to attracting interest and creating a strong negotiating position.
Looking Ahead
As we move further into the fall market, I will be watching the relationship between new inventory and under-contract activity particularly closely to see whether the momentum we saw in September continues through the final months of 2026.
The Princeton market is rarely one-size-fits-all. Conditions can vary considerably by neighborhood, property type, condition, and price point, making it important to understand the market surrounding a particular property.
Princeton Area Overview
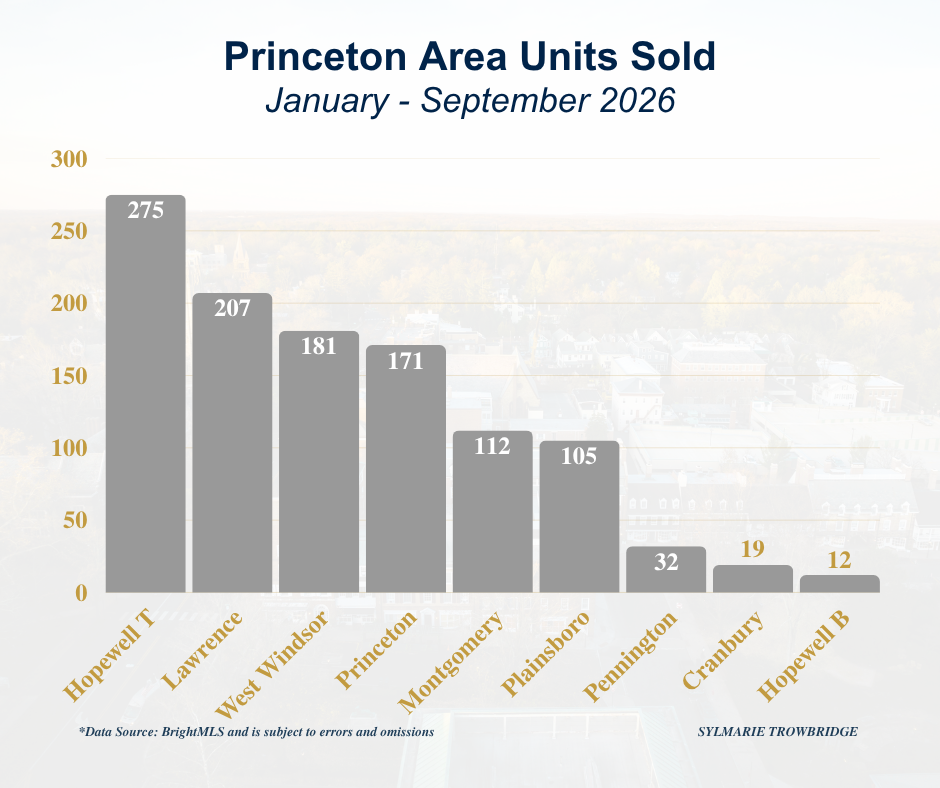
Across the broader Princeton area, Hopewell Township recorded the greatest number of sales through September with 275 transactions, followed by Lawrence with 207, West Windsor with 181, and Princeton with 171.
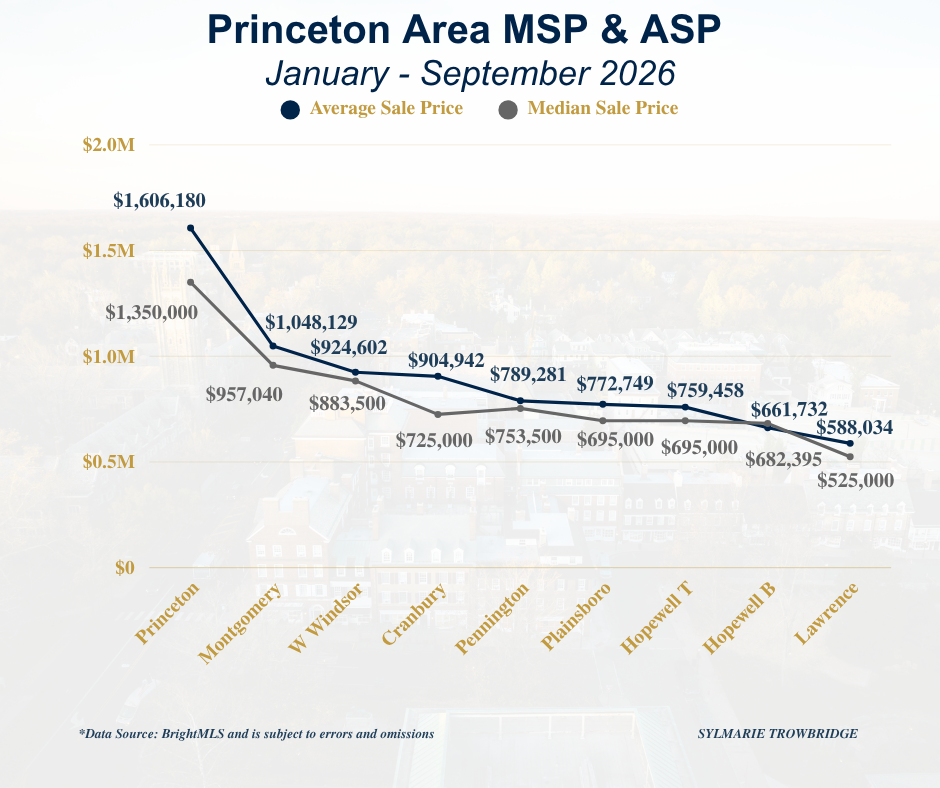
Princeton continues to command the highest average and median sale prices among the markets included in this report, with an average sale price of $1,606,180 and a median of $1,350,000. Montgomery and West Windsor follow Princeton on both measures.
Final Thought
September is a good reminder of why it is important to look beyond any one market statistic. The numbers can tell very different stories depending on whether we are looking at closings, contracts, pricing, or inventory.
For buyers and sellers, understanding what is happening within a particular neighborhood, price point, and property type remains far more useful than relying on any single headline number.
As always, if you are thinking about buying, selling, or would simply like to better understand the Princeton area real estate market, please feel free to call (917-386-5880), text, or email me. I am always happy to be a resource!

