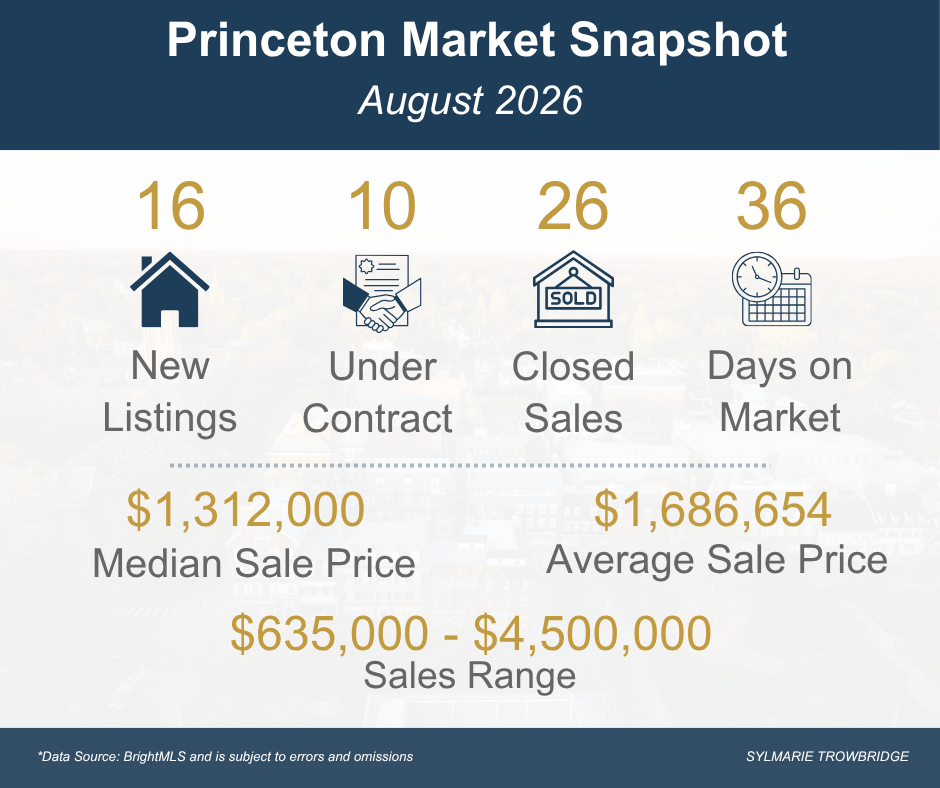
August brought relatively steady activity to the Princeton real estate market compared with the same month last year. While the market remains active and buyers continue to purchase homes across a wide range of price points, the increase in marketing time may indicate that they are taking a more measured approach.
As always, it is important to note that a meaningful number of Princeton transactions occur outside of BrightMLS, particularly within the luxury market. Because these off-market sales are not reflected in the data below, the statistics provide an important snapshot of market activity, but they do not represent every transaction taking place. In addition, BrightMLS made changes earlier this year to the way it reports new listing activity, so some of the comparisons with prior periods may look a little wonky.
As a reminder, I continue to use 2019 as a pre-pandemic baseline alongside the most recent three years of data. I believe this provides helpful context for understanding how much the Princeton market has evolved.
Now, let’s take a closer look at the data.
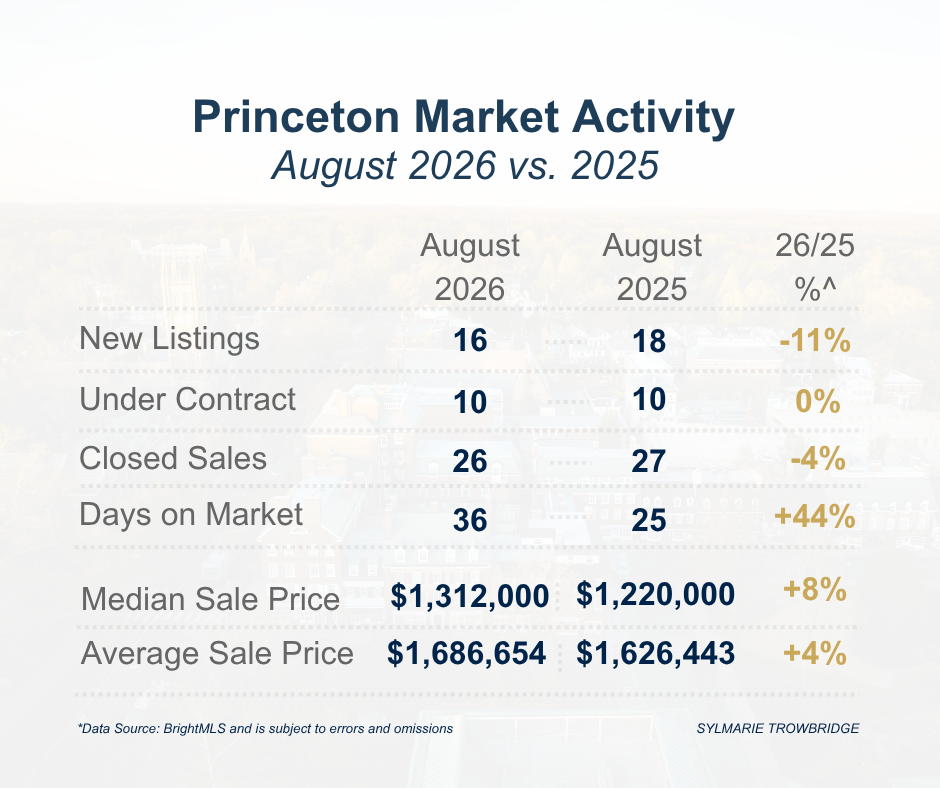
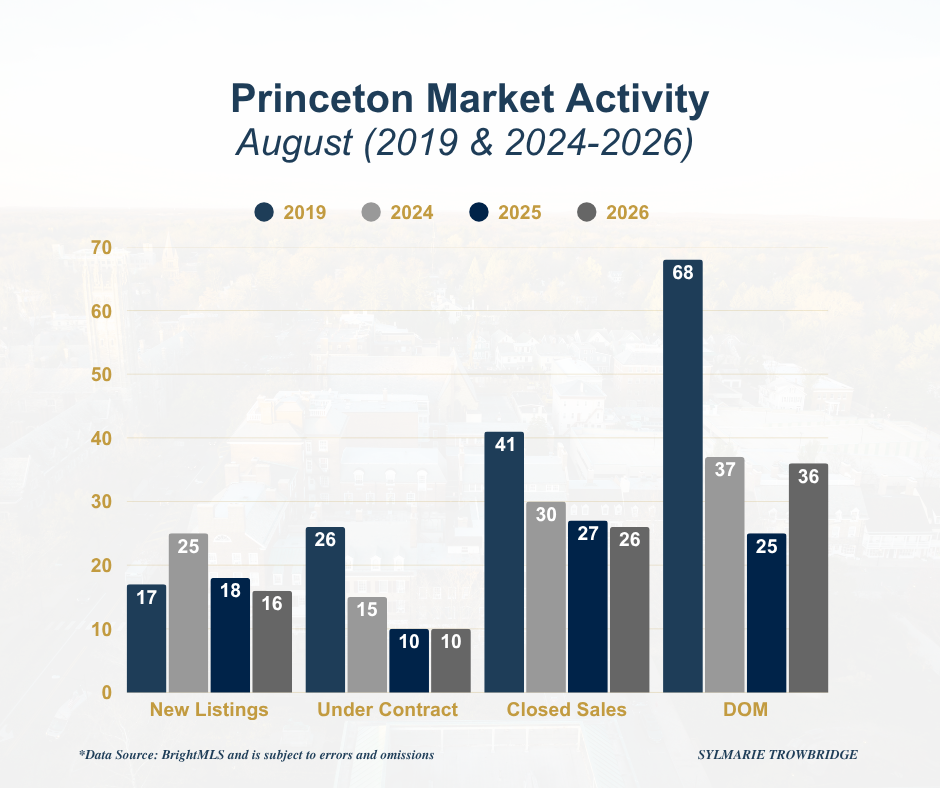
August’s transaction counts were remarkably close to last year. New listings declined from 18 to 16, under-contract activity was unchanged at 10, and closed sales declined by just one transaction, from 27 to 26. The more notable change was in marketing time. Homes that closed in August spent an average of 36 days on the market, a 44% increase from the 25 days in August 2025. Even with that increase, homes are still selling considerably faster than they did before the pandemic, when August 2019 closings averaged 68 days on the market.
I think it is important to note that the increase in days on market does not necessarily signal a lack of buyer demand, particularly when contract and closing activity remained essentially unchanged from August 2025.
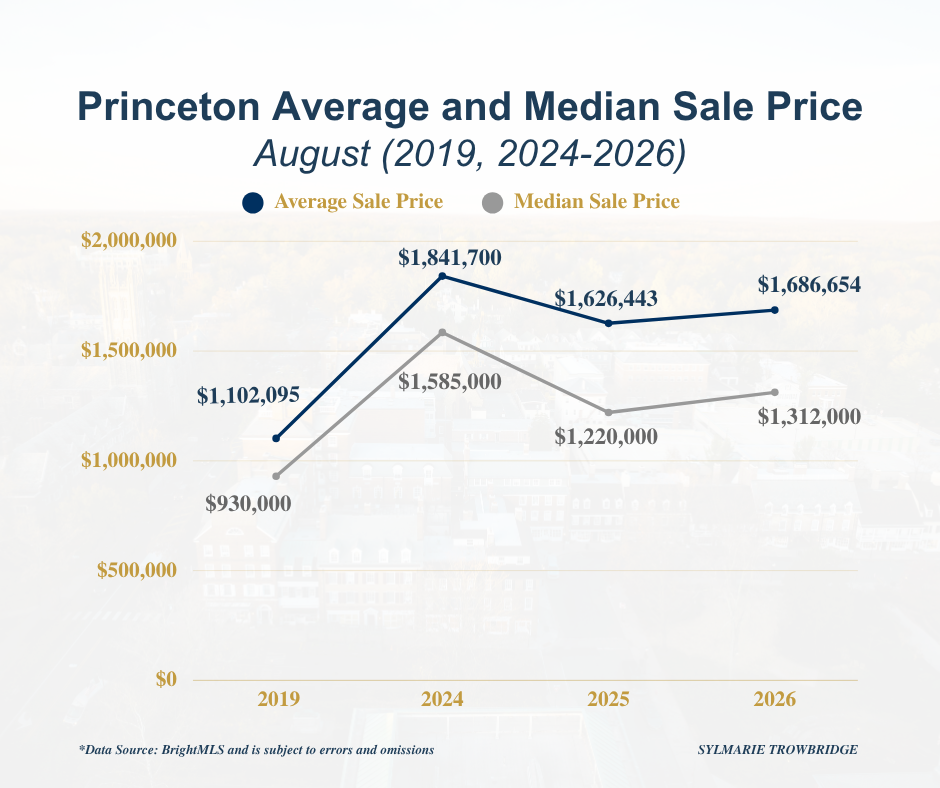
At the same time, limited inventory continues to provide support for pricing. The median sale price increased 8% to $1,312,000, while the average sale price increased 4% to $1,686,654. Sales ranged from $635,000 to $4.5 million.
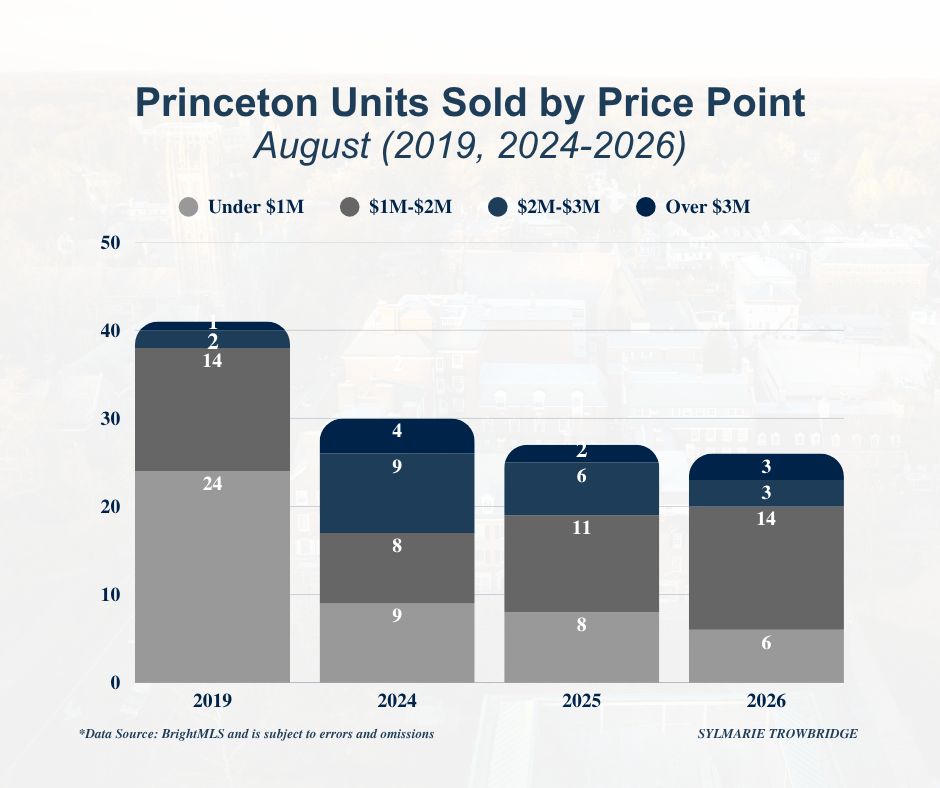
August’s price-point distribution provides some useful context. Approximately 77% of reported sales were above $1 million, compared with 70% in August 2025 and just 41% in August 2019, illustrating how much Princeton’s market has shifted toward higher price points.
Year-to-Date Trends
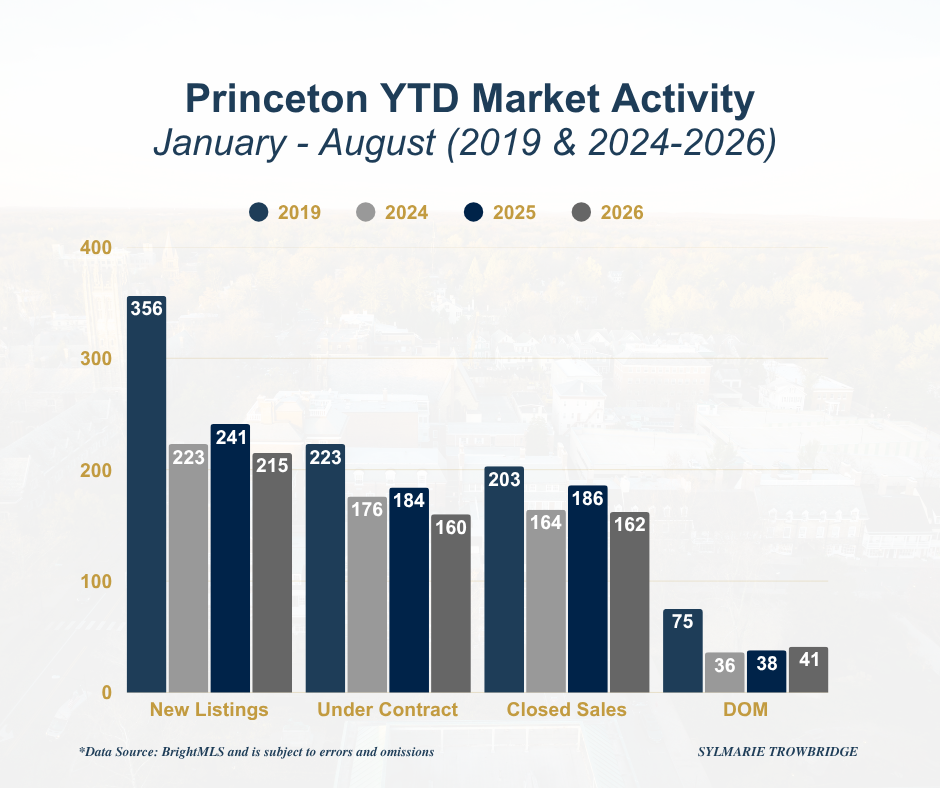
Now that we have eight months of data, the year-to-date numbers provide a broader and more useful perspective on the direction of the market. Through August, BrightMLS recorded 215 new listings, approximately 11% below the 241 recorded during the same period last year. A total of 160 homes went under contract, down approximately 13% from 184 last year, while 162 homes closed, also approximately 13% below the 186 recorded in 2025.
While we cannot attribute lower transaction volume to any single factor, the similarity between these declines suggests that limited inventory continues to play a role. Simply put, fewer homes coming to market means fewer opportunities for buyers and, ultimately, fewer potential transactions.
Year-to-date, homes have spent an average of 41 days on the market, up modestly from 38 days in 2025, but still well below the 75-day average recorded during the same period in 2019.
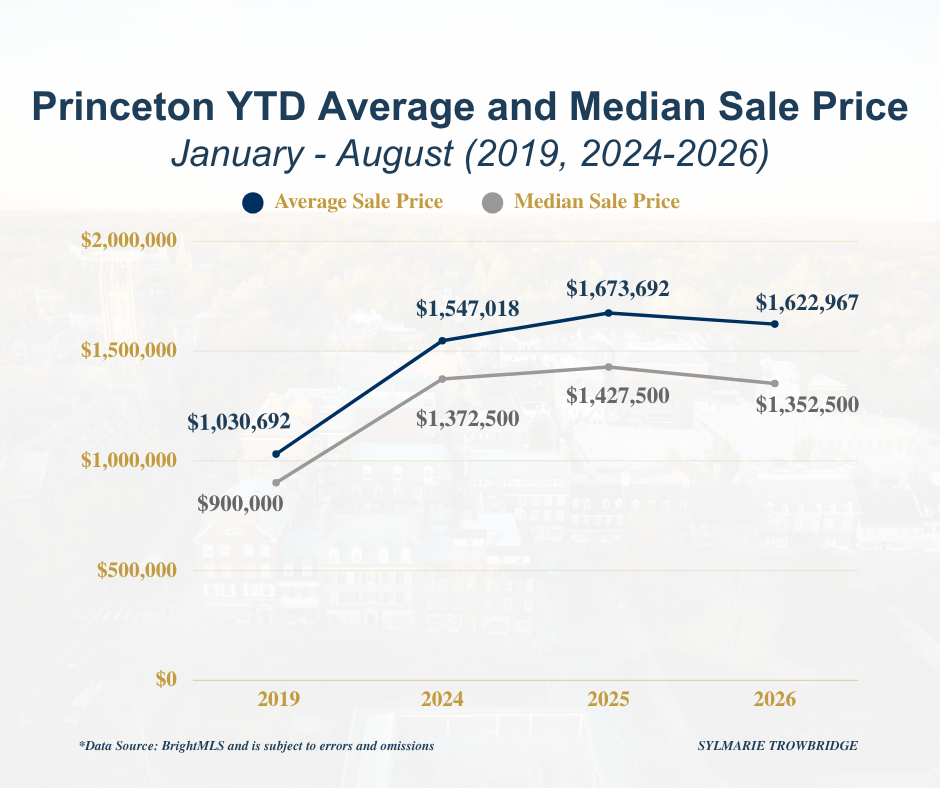
Through August, Princeton’s average sale price decreased approximately 3% compared with the same period last year, while the median sale price declined approximately 5%. While both measures are below 2025 levels, they remain substantially higher than before the pandemic. Compared with the same period in 2019, the average sale price is approximately 57% higher and the median is approximately 50% higher.
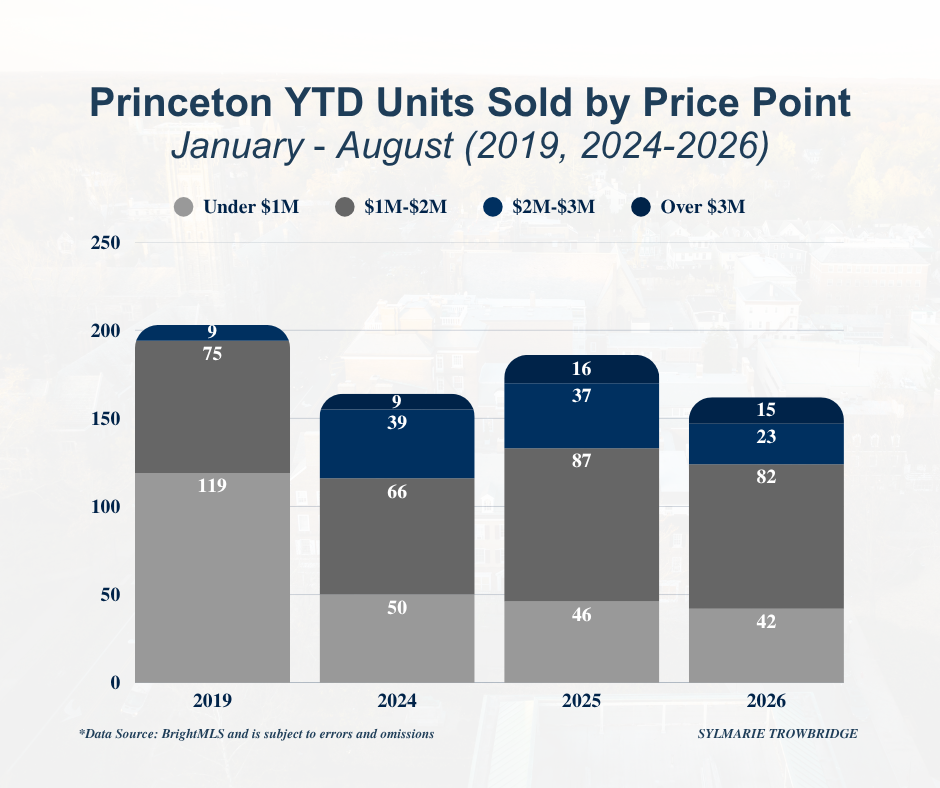
The mix of homes sold also helps put these numbers in perspective. Through August, 23.5% of reported sales were above $2 million, compared with 28.5% in 2025, with much of the difference coming from fewer sales in the $2 million to $3 million range. Activity above $3 million was nearly unchanged. This shift in the mix of properties sold likely contributed to the lower year-to-date average and median sale prices and is another reason to look beyond the headline numbers when evaluating the market.
What This Means
For Buyers
Longer marketing times may create opportunities, especially with properties that have been on the market for a while or have experienced a price adjustment. Not every home is attracting the same level of competition, which can give buyers more room to negotiate.
Inventory, however, remains limited. Buyers should be prepared to move decisively when the right property becomes available, recognizing that the appropriate strategy will depend on the property, price point, and level of competition.
For Sellers
August’s data reinforces the importance of positioning a property appropriately from the start. Buyers remain active, but longer marketing times mean sellers should not assume every property will sell immediately. Pricing, preparation, and marketing strategy all play an important role in attracting buyer interest and creating the strongest possible negotiating position.
Looking Ahead
As we move into the fall market, I will be watching two things particularly closely: the number of new properties coming to market and how long homes are taking to sell. Limited inventory continues to shape transaction volume, but the increase in marketing time adds another dimension. If more inventory becomes available this fall, it will be interesting to see how buyers respond to having additional choices.
The Princeton market is rarely one-size-fits-all. Conditions can vary considerably by neighborhood, property type, condition, and price point, making it increasingly important to understand the market surrounding a particular property.
Princeton Area Overview
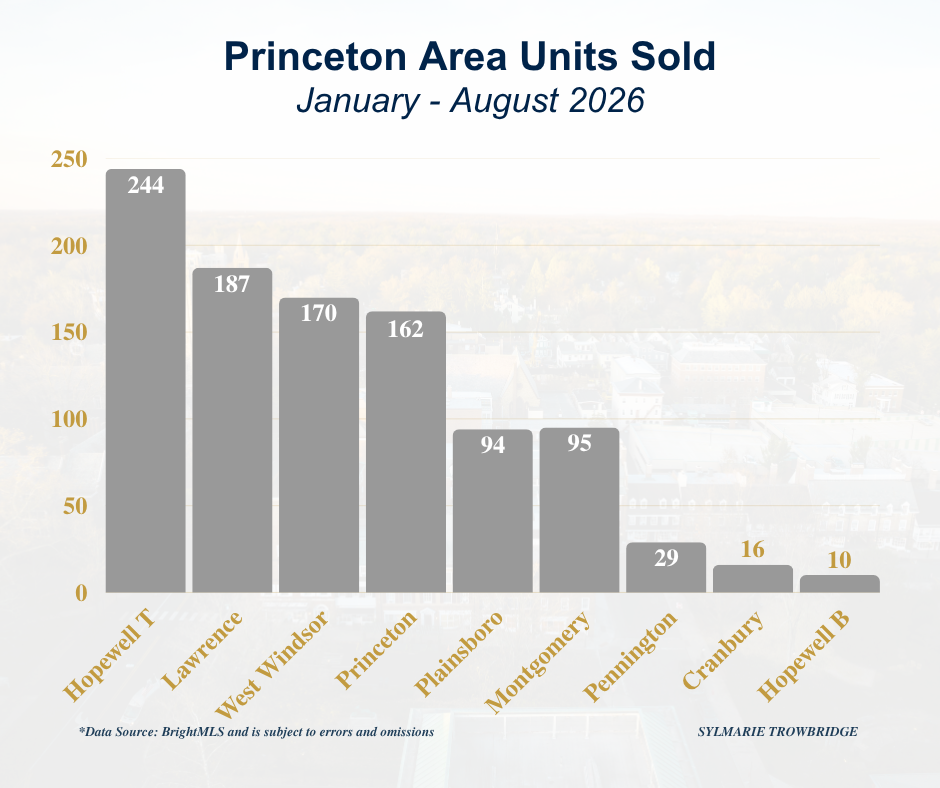
The broader Princeton-area market continues to show considerable variation across towns and price points. Through August, Hopewell Township recorded the greatest number of sales among the markets included in this report, with 244 transactions, followed by Lawrence with 187, West Windsor with 170, and Princeton with 162.
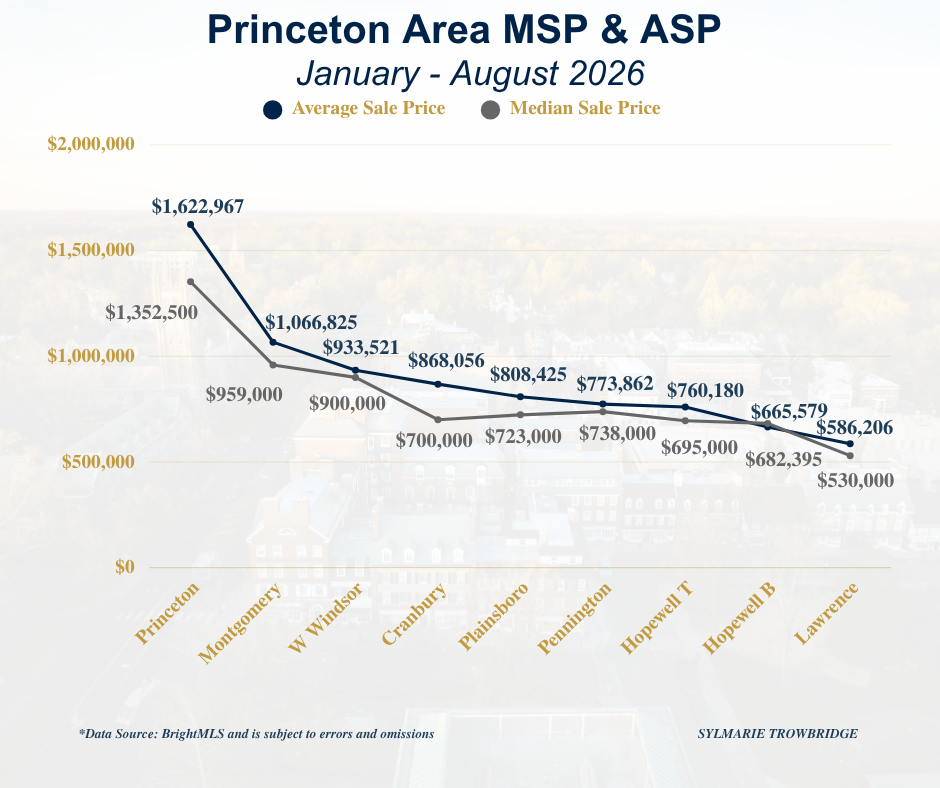
Princeton continues to command the highest average and median sale prices in the region, followed by Montgomery and West Windsor.
Final Thought
As we move into the fall, the dynamics surrounding an individual property will matter just as much as the broader market trends. Understanding the nuances of a particular neighborhood, price point, and property will be increasingly important for both buyers and sellers.
As always, if you are thinking about buying, selling, or would simply like to better understand the Princeton area real estate market, please feel free to call (917-386-5880), text, or email me. I am always happy to be a resource!
 Sylmarie Trowbridge | Princeton Luxury Real Estate | Callaway Henderson Sotheby's