July Market Update
July’s market data reinforces a theme that has been developing throughout 2026: Princeton continues to operate with limited inventory, and that constraint appears to be influencing overall transaction volume.
At first glance, July may appear softer than the same month last year, with fewer properties going under contract and fewer sales closing. However, the year-over-year comparison becomes more meaningful when viewed within the broader year-to-date picture.
Through July, the decline in under-contract activity has tracked remarkably closely with the decline in new listings. At the same time, homes that sold during July moved considerably faster than they did a year ago. These trends suggest that buyer demand remains strong, even as limited inventory constrains the number of transactions.
As always, it is important to note that a meaningful number of Princeton transactions occur outside of BrightMLS, particularly within the luxury market. Because these off-market sales are not reflected in the data below, the statistics provide an important snapshot of market activity, but they do not represent every transaction taking place.
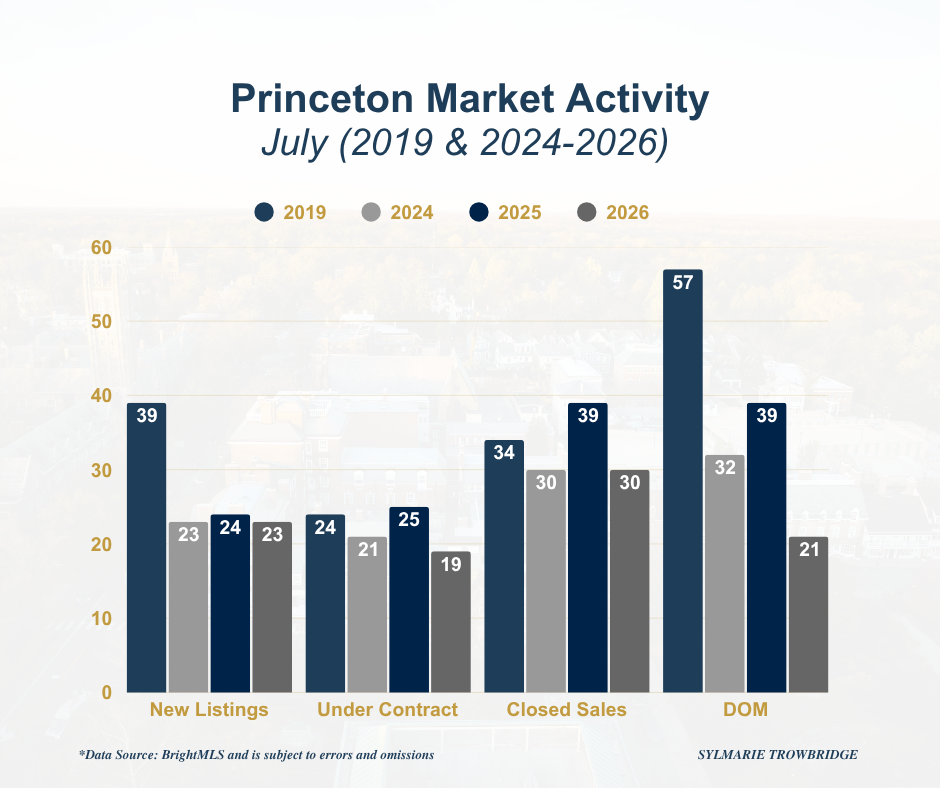
As a reminder, I continue to use 2019 as a pre-pandemic baseline alongside the most recent three years of data. I believe this provides helpful context for understanding how much the Princeton market has changed.
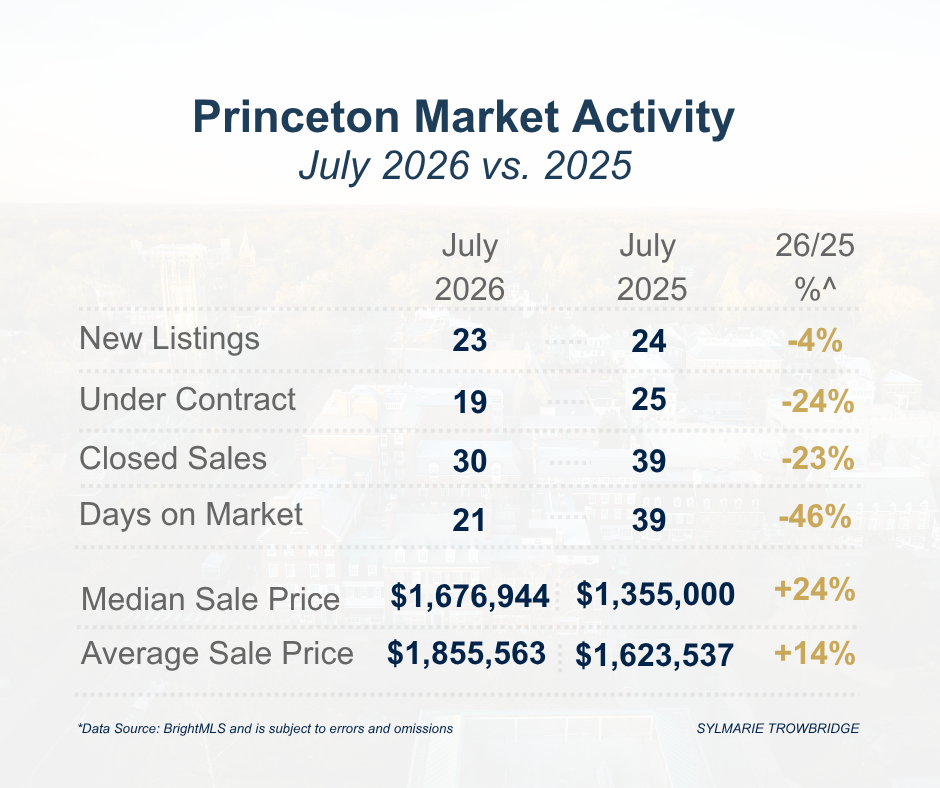
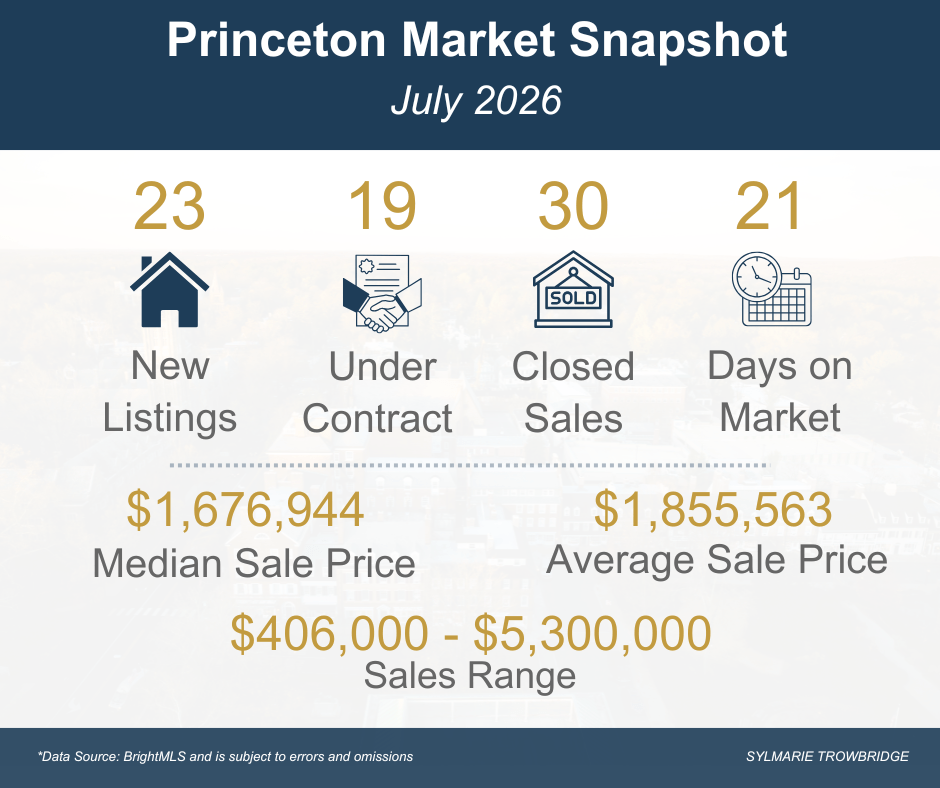
July brought 23 new listings to the Princeton market, compared with 24 during the same month last year. Nineteen properties went under contract, down from 25 in July 2025, while 30 properties closed, compared with 39 last year.
The median sale price was $1,676,944 and the average sale price was $1,855,563, with sales ranging from $406,000 to $5.3 million. Homes that closed spent an average of just 21 days on the market, compared with 39 days last July.
While the 24% decline in under-contract activity may initially suggest softer buyer demand, I think it is important to consider the number of homes available for buyers to purchase. Only 23 new listings came to market during July, and 19 properties went under contract. Although those figures do not necessarily represent the same homes, they suggest that buyers continued to absorb a meaningful share of available inventory.
Perhaps even more telling is the decline in average days on market. Properties that closed in July spent an average of just 21 days on the market, down 46% from last July and well below the 57-day average recorded in July 2019.
That combination of limited inventory and relatively quick sales suggests a market in which buyers remain engaged, but focused on properties that meet their expectations for price, condition, and presentation.
Pricing was another notable part of July’s market activity. The median sale price increased 24% compared with July 2025, while the average sale price increased 14%.
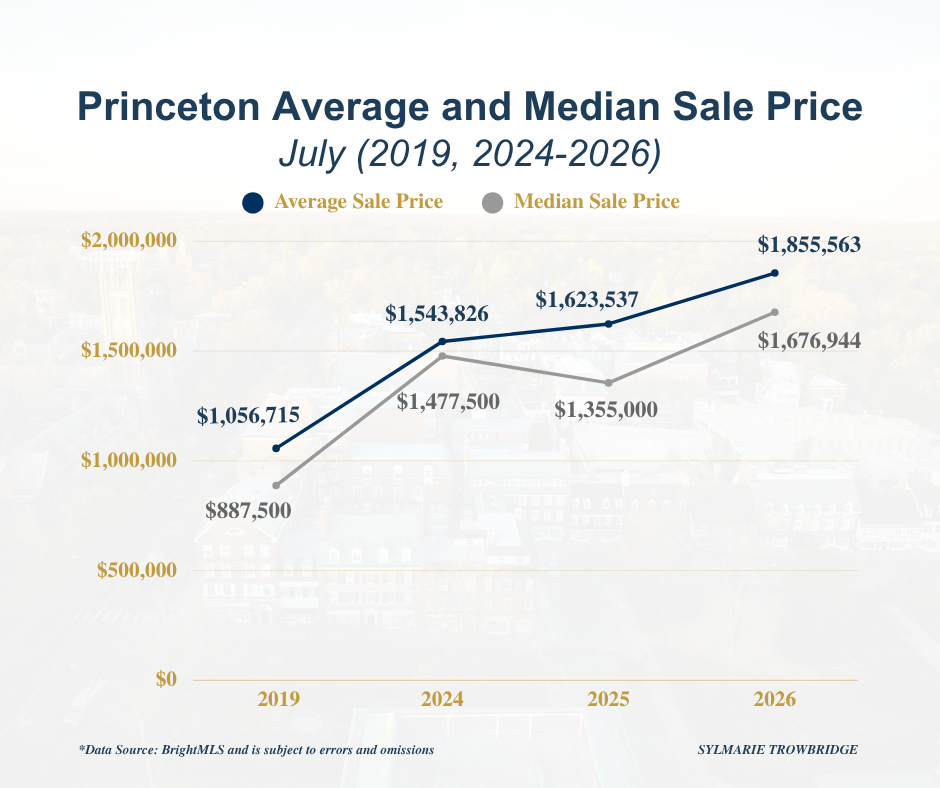
As always, monthly pricing figures should be interpreted carefully. July included a sale at $5.3 million, which influenced the average, and the relatively small number of monthly transactions means that changes in the mix of homes sold can have an outsized effect on both average and median pricing.
Still, July’s results reinforce the broader strength that continues to characterize the Princeton market, particularly for well-positioned properties.

The mix of July sales also reflects how Princeton’s market has shifted over time, with a greater share of transactions now occurring above $2 million than before the pandemic.
Year-to-Date Trends
The year-to-date numbers provide perhaps the most useful context for understanding July.
Through the first seven months of 2026:
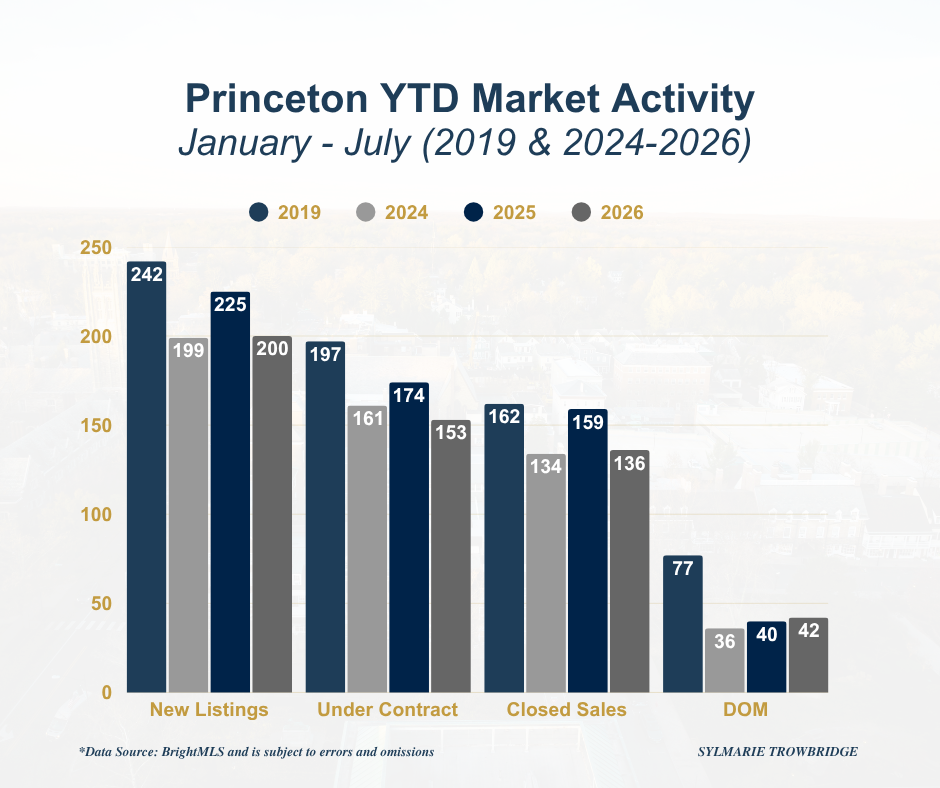
• New listings declined from 225 to 200 compared with the same period last year, a decrease of approximately 11%.
• Under-contract activity declined from 174 to 153, a decrease of approximately 12%.
• Closed sales declined from 159 to 136, a decrease of approximately 14%.
What stands out to me is how closely the decline in under-contract activity mirrors the decline in new listings. While it is impossible to attribute transaction volume to any single factor, the similarity between those figures suggests that limited inventory, rather than a broad pullback in buyer demand, continues to be an important factor shaping the market.
The comparison with 2019 is even more striking. Princeton continues to operate with substantially fewer new listings than it did before the pandemic, yet buyers are absorbing a much greater proportion of the homes that become available. This remains one of the clearest indications of how fundamentally the Princeton market has changed since the pandemic.
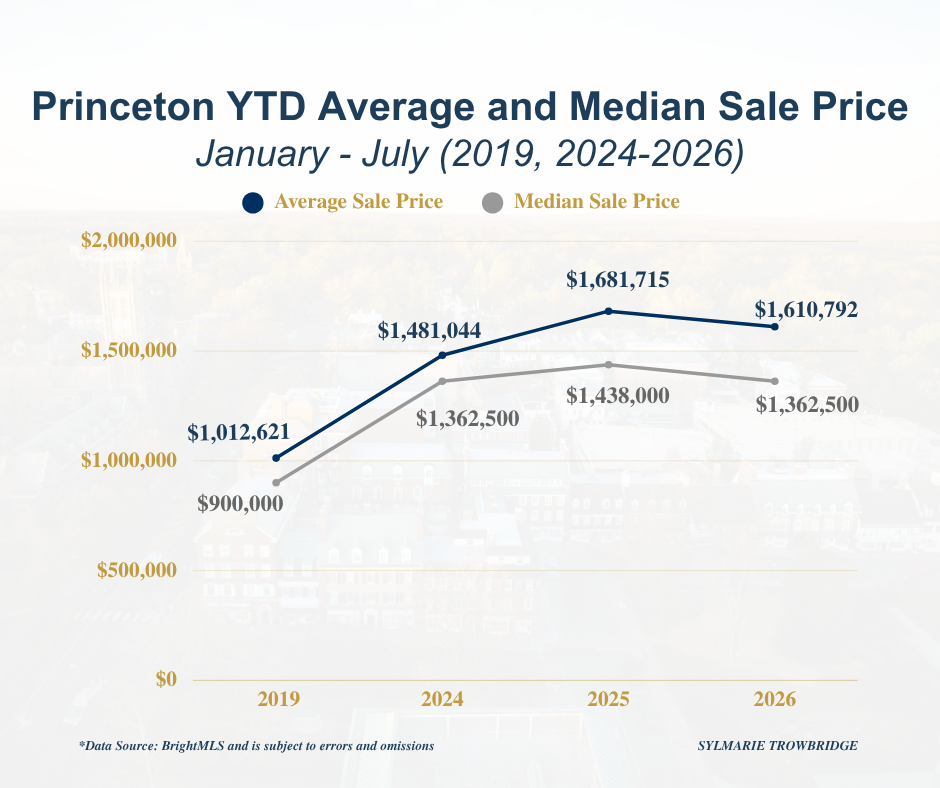
Year-to-date pricing also provides important perspective.
While 2026 pricing remains below the exceptionally strong levels recorded in 2025, both average and median sale prices remain well above pre-pandemic levels. As I have noted throughout the year, differences in the mix of properties sold, along with luxury transactions occurring outside BrightMLS, can meaningfully influence these figures.
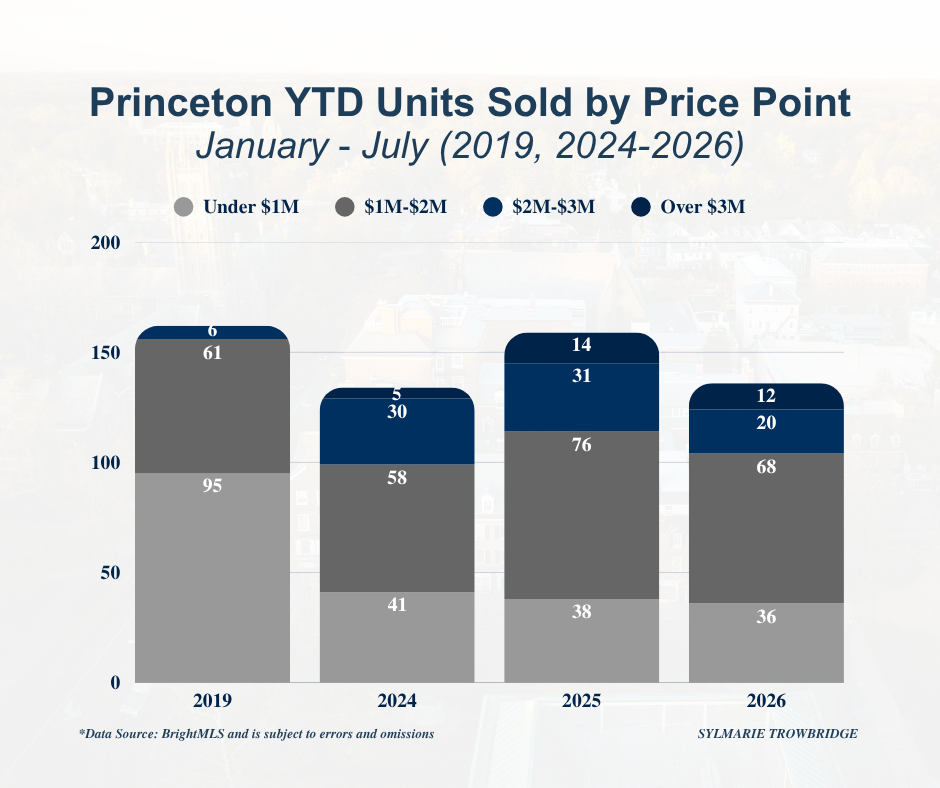
The distribution of sales by price point also continues to show that the $1 million to $2 million segment represents the largest portion of Princeton’s market. Through July, BrightMLS recorded 12 sales above $3 million, compared with 14 during the same period last year.
What This Means
For Buyers
Limited inventory continues to make preparation important. While buyers may encounter more negotiating opportunities with properties that have been on the market longer or were initially priced too aggressively, well-priced and thoughtfully presented homes can still move quickly.
July’s 21-day average marketing time is a good reminder that when the right property becomes available, buyers should be prepared to act decisively.
For Sellers
The data continues to favor sellers who approach the market strategically. Buyer demand remains strong, but today’s buyers are discerning. Pricing, condition, presentation, and marketing strategy all play an important role in determining how quickly a property attracts interest.
The fact that July homes sold considerably faster than they did a year ago reinforces that buyers will respond when a property is positioned appropriately.
Looking Ahead
As we move through the second half of the year, I will be watching the relationship between new inventory and buyer activity particularly closely.
If the number of new listings remains constrained, transaction volume may continue to trail last year’s levels even if underlying buyer demand remains healthy. If inventory increases, it will be interesting to see how buyers respond to having more choices.In a market like this, my role is to help clients look beyond the headline numbers and understand what the data is actually telling us.
Princeton Area Overview
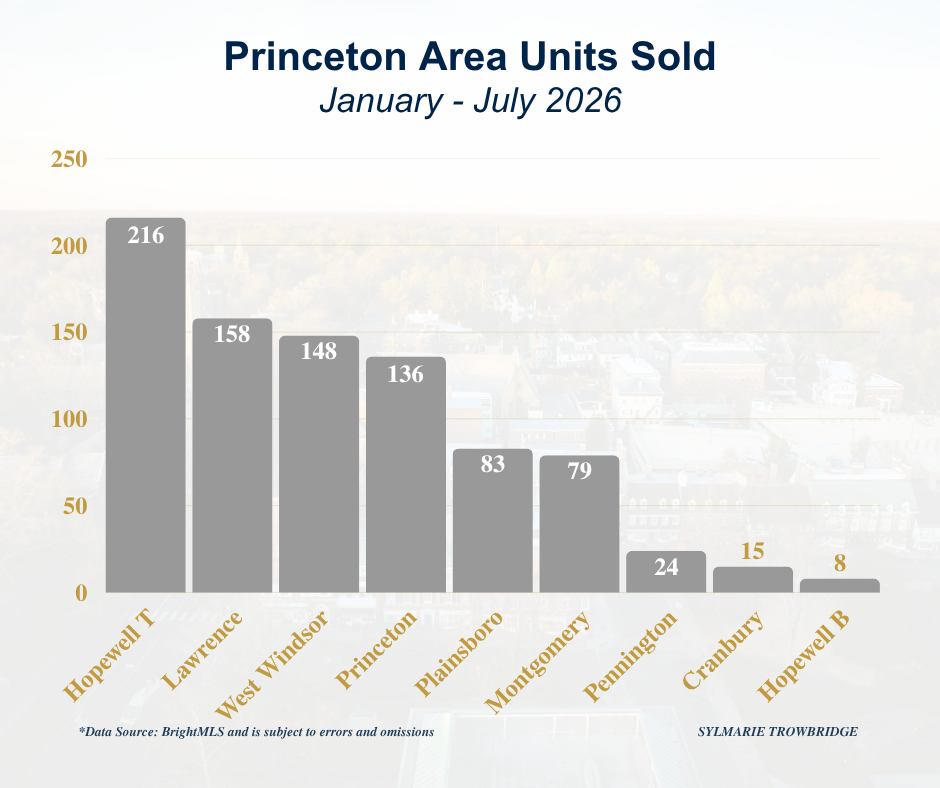
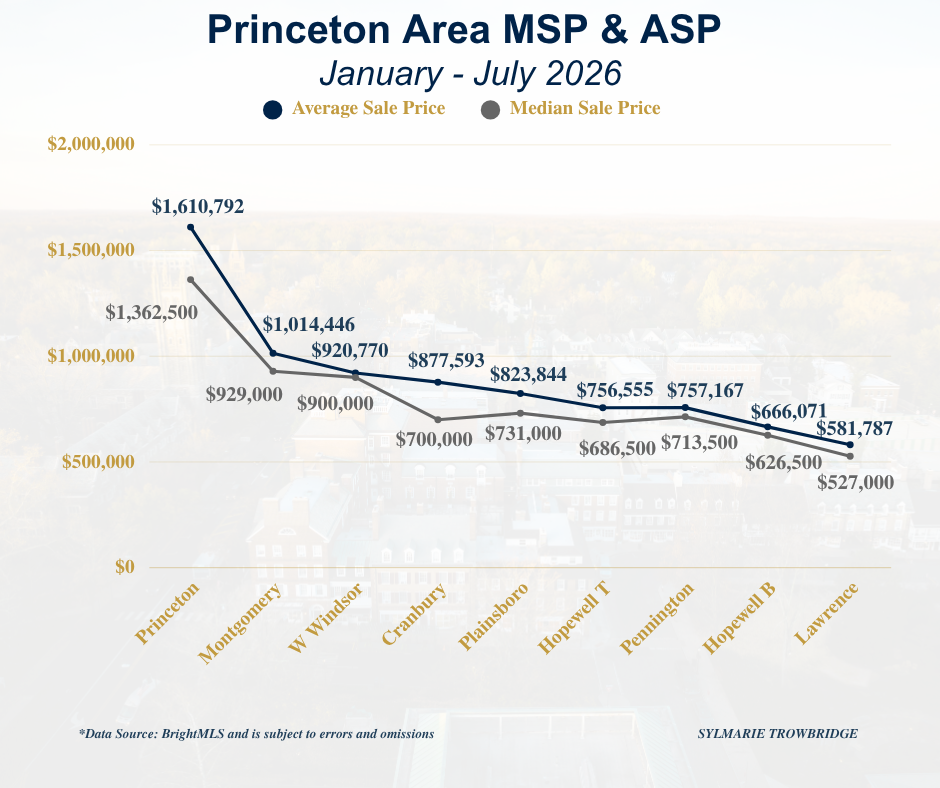
The broader Princeton-area market continues to demonstrate varying dynamics across towns and price points. Hopewell Township leads the region in units sold through July, followed by Lawrence and West Windsor. Princeton continues to command the highest average and median sale prices in the region, followed by Montgomery and West Windsor.
Final Thought
July’s numbers are a good reminder that fewer transactions do not necessarily mean less demand. With new listings and under-contract activity declining at nearly the same rate year-to-date, limited supply continues to be an important part of the Princeton market story.
As always, if you are thinking about buying, selling, or would simply like to better understand the Princeton area real estate market, please feel free to call (917-386-5880), text, or email me. I am always happy to be a resource!

