As we move further into the spring market, March offers a more nuanced picture of current conditions. As you know, I love data and genuinely enjoy sharing it, but this is one of those moments where the numbers require additional context.
Between the number of off-market transactions and recent changes in how BrightMLS reports new listings, the data I am about to share may feel somewhat “wonky.” As such, I will provide additional perspective to help make sense of it.
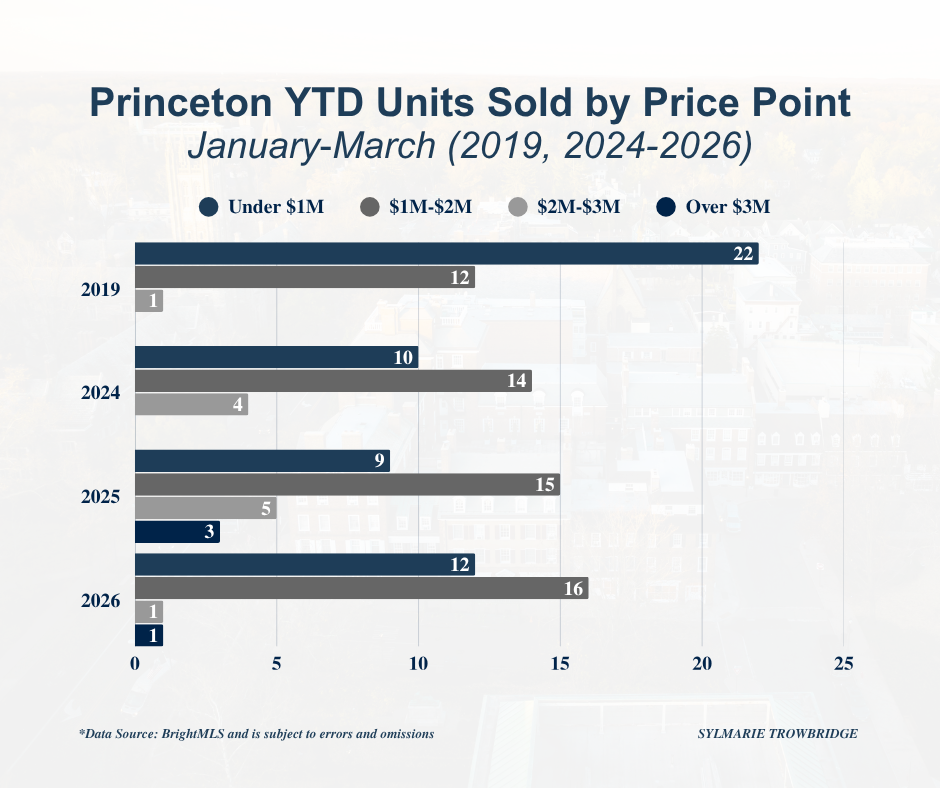
Let’s start with the off-market activity. Year-to-date, I am aware of at least nine properties that are either under contract or have traded between approximately $1.2M and $3.5M, and there are likely others. Because this information is not reflected in BrightMLS data, my analysis should be viewed with this context in mind.
As a quick note, and in the spirit of continuous improvement, I have slightly refined how I present the monthly data. Rather than showing every year side by side to show pandemic market conditions, I am using 2019 as a pre-pandemic baseline and pairing it with the most recent three years to provide a clearer view of current market trends.
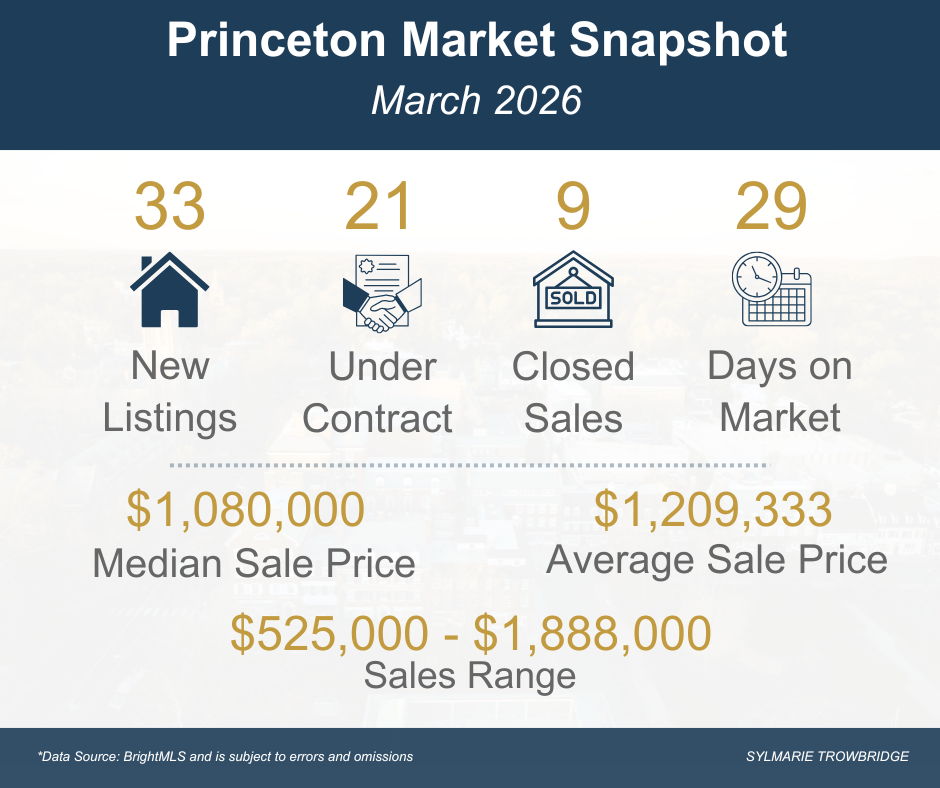
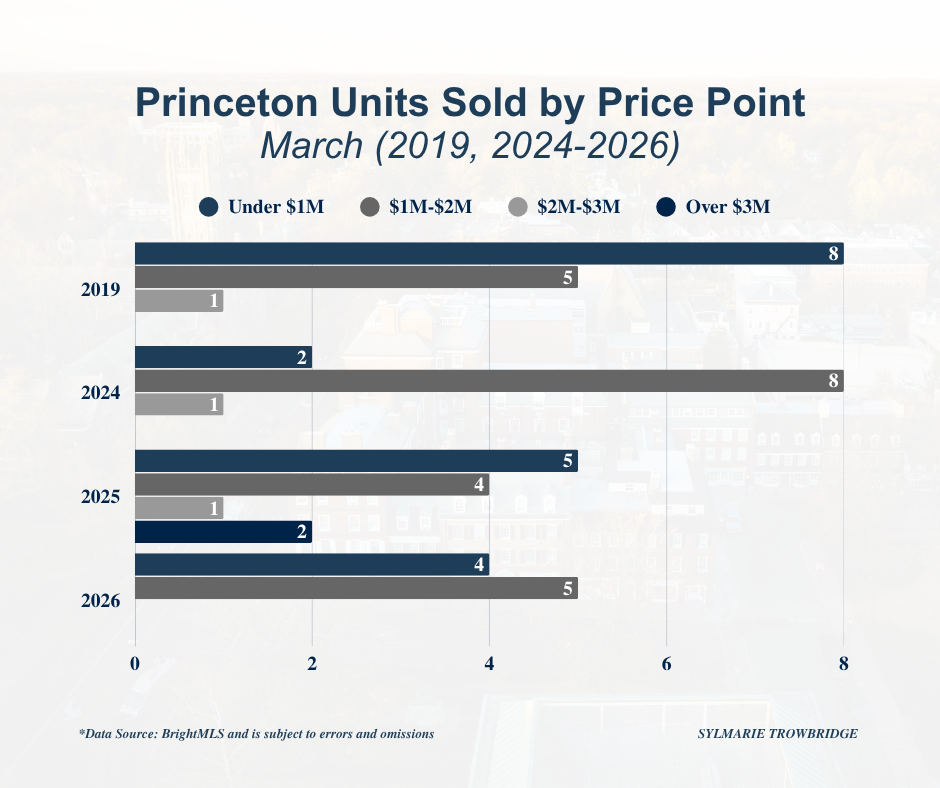
This March, there were 21 properties that went under contract and 9 closed sales, with a median sale price of $1,080,000 and an average sale price of $1,209,333. Homes sold in an average of 29 days, with sale prices ranging from $525,000 to $1,888,000, and at an average of 104.2% of their original list price.
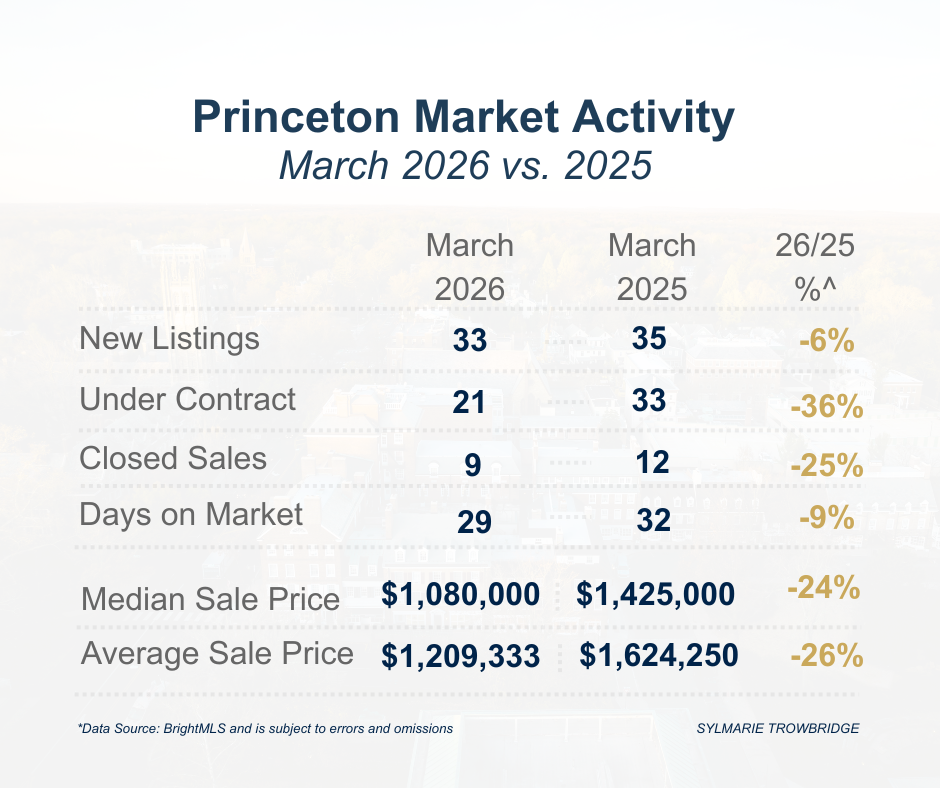
At first glance, pricing appears to have declined compared with March of last year. However, it is important to look beyond the surface. The March 2025 data included two sales above $3M, whereas this year’s highest BrightMLS sale was $1,888,000. As a result, the year-over-year change largely reflects differences in the sales mix, as well as incomplete visibility due to off-market activity, rather than a meaningful shift in underlying value.
Another data point to unpack is the 36% decrease in the number of properties to go under contract relative to March 2025. This is likely due in part to lower starting inventory, as well as the timing of new listings, with approximately one-third of properties introduced in the final two weeks of March.
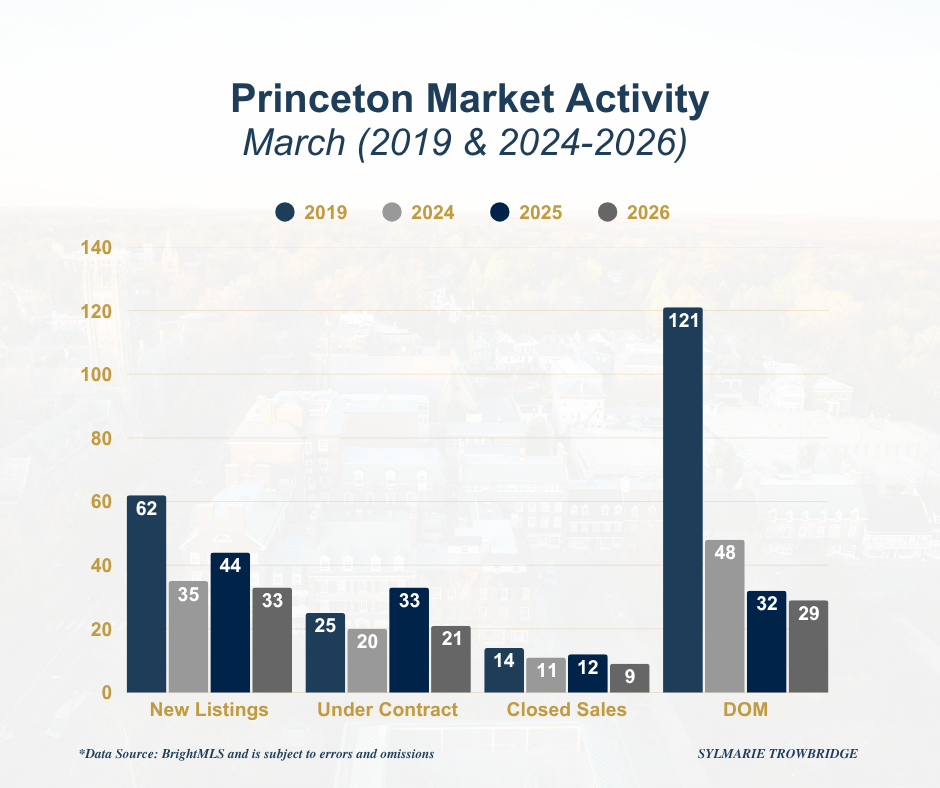
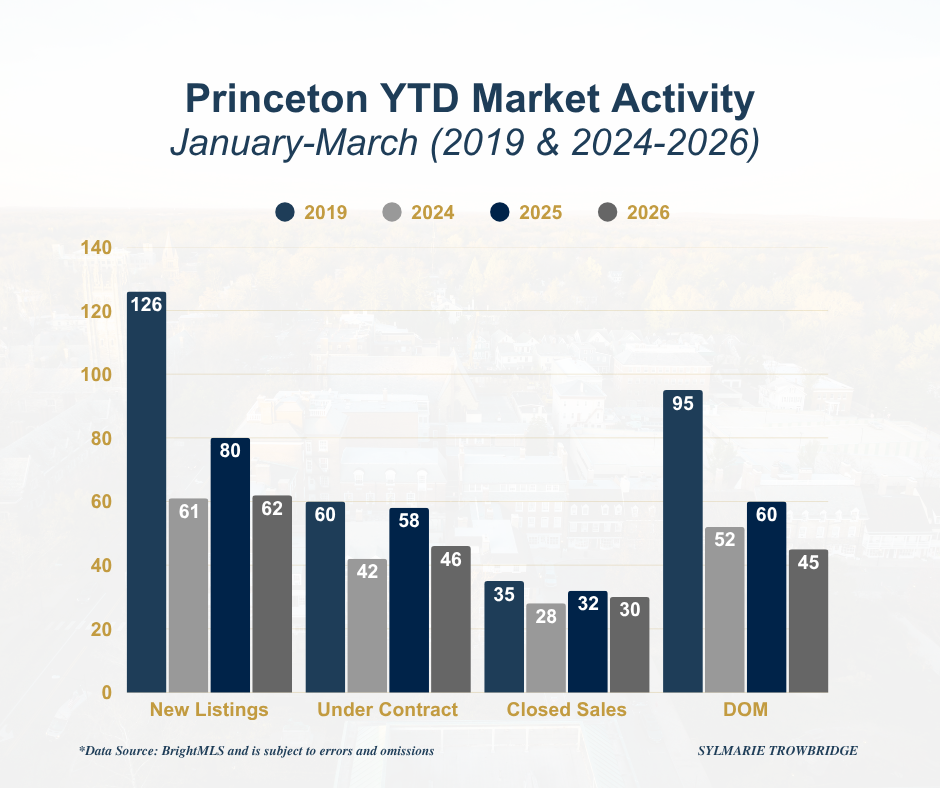
When viewed across recent years, March 2026 saw the fewest new listings and closed sales, along with the fastest average days on market. It is notable how efficiently the market has operated post-COVID, maintaining comparable levels of activity with significantly fewer listings, moving at less than a quarter of the pace seen in 2019.
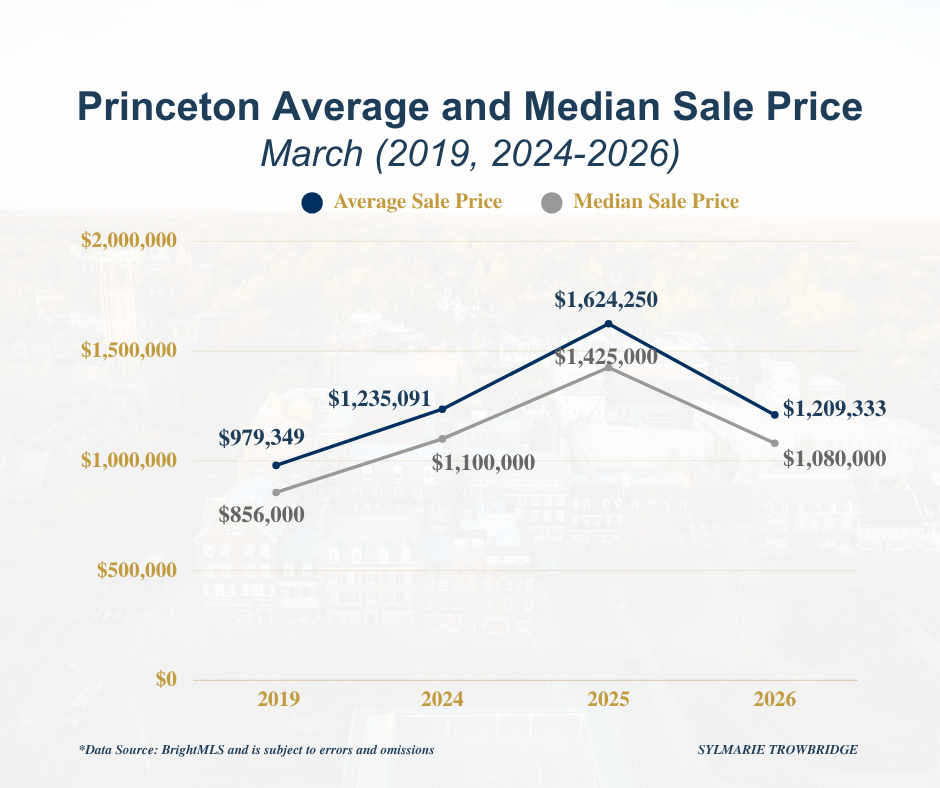
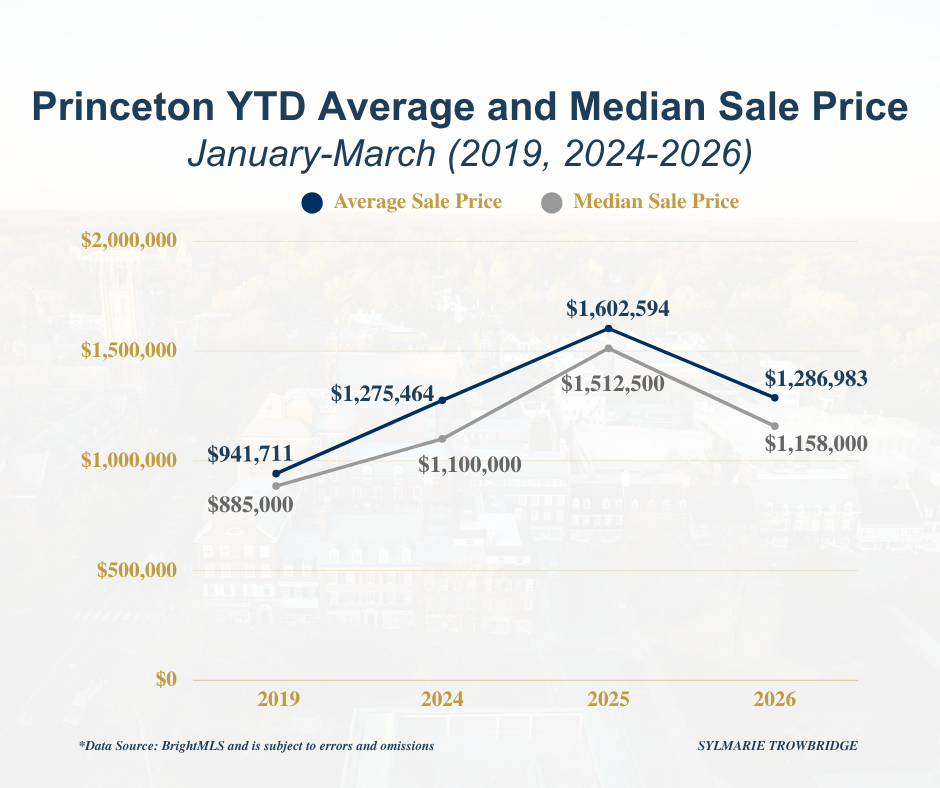
Given the level of demand and limited supply, pricing trends continue to reflect a market that has strengthened over time, even as short-term fluctuations are driven by the mix of properties sold and the level of off-market activity.
Year-to-Date Trends
When viewed year-to-date, buyer demand is reflected in the average days on market at a mere 45 days, as well as the number of under contract and closed properties given the limited available inventory.
What This Means
For Buyers
In a market with limited inventory, preparation remains essential. When the right property becomes available, the ability to act decisively remains important. While certain pockets of the market remain highly competitive, others offer meaningful opportunities, particularly for buyers who are open to updating or considering locations slightly outside their initial focus.
For Sellers
Low inventory continues to create a meaningful opportunity. Many sellers remain hesitant to list, even as buyer demand persists. Properties that are positioned thoughtfully from the outset tend to generate early interest and achieve strong outcomes.
Looking Ahead
The market appears to be experiencing a delayed spring rather than a diminished one. As we move further into the season, inventory may begin to build. If that occurs, it may give buyers more options while still maintaining a level of competition, given the underlying demand.
In a market like this, my role is to provide clarity by helping sellers position their homes to align with current buyer behavior and preparing buyers to recognize and act on the right opportunity when it presents itself.
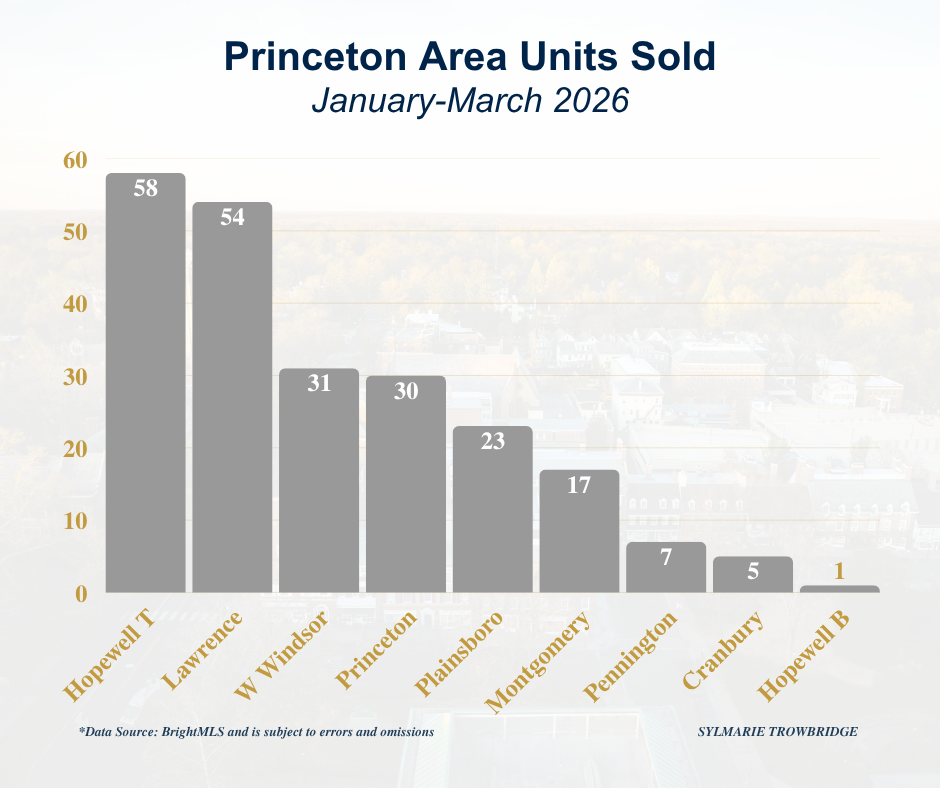
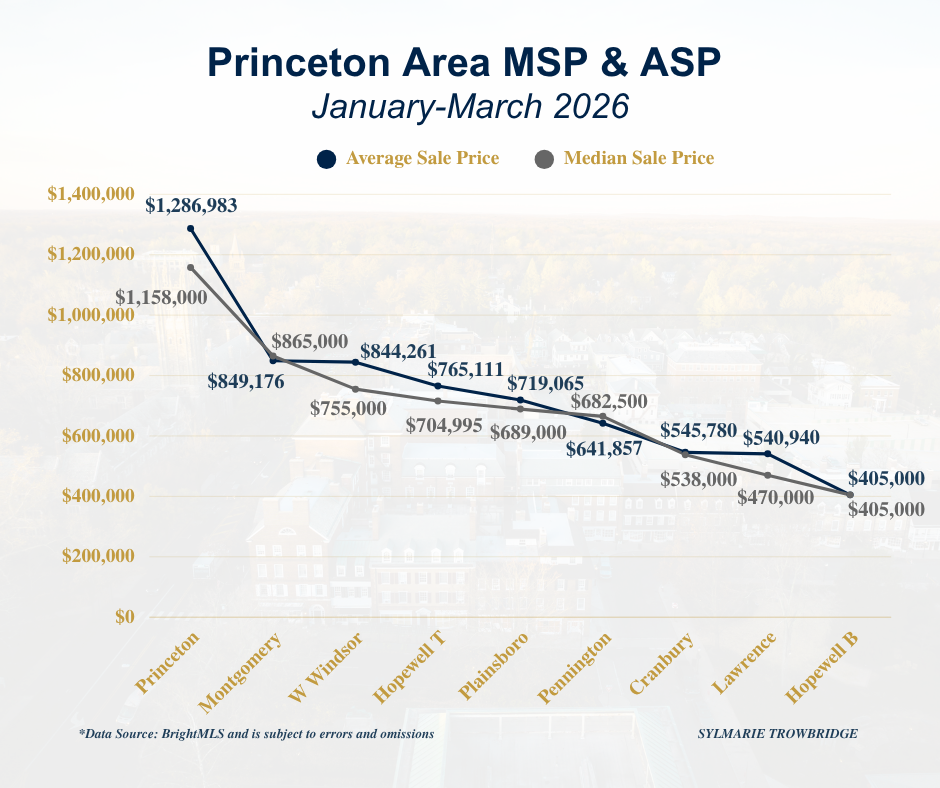
Princeton Area Overview
Now that we have a quarter’s worth of data, I wanted to provide additional perspective for those curious about activity in the surrounding area. As you will see, Hopewell leads with the most units sold, followed by Lawrence, West Windsor, and Princeton. Princeton continues to rank highest in both median and average sale prices, followed by Montgomery and West Windsor.
Final Thought
While the data may suggest short-term fluctuations, the underlying story remains consistent: demand is present, inventory is limited, and thoughtful strategy continues to drive results.
As always, if you are thinking about buying, selling, or would like to learn more about the Princeton area real estate market, please feel free to call (917-386-5880), text, or email me.
