As we begin the new year, the January data offers an early look at how the Princeton market is finding its footing after several years of significant change. While one month, particularly one marked by cold and snowy conditions, never defines a year, it can often provide helpful signals regarding inventory levels, transaction pace, and buyer engagement.
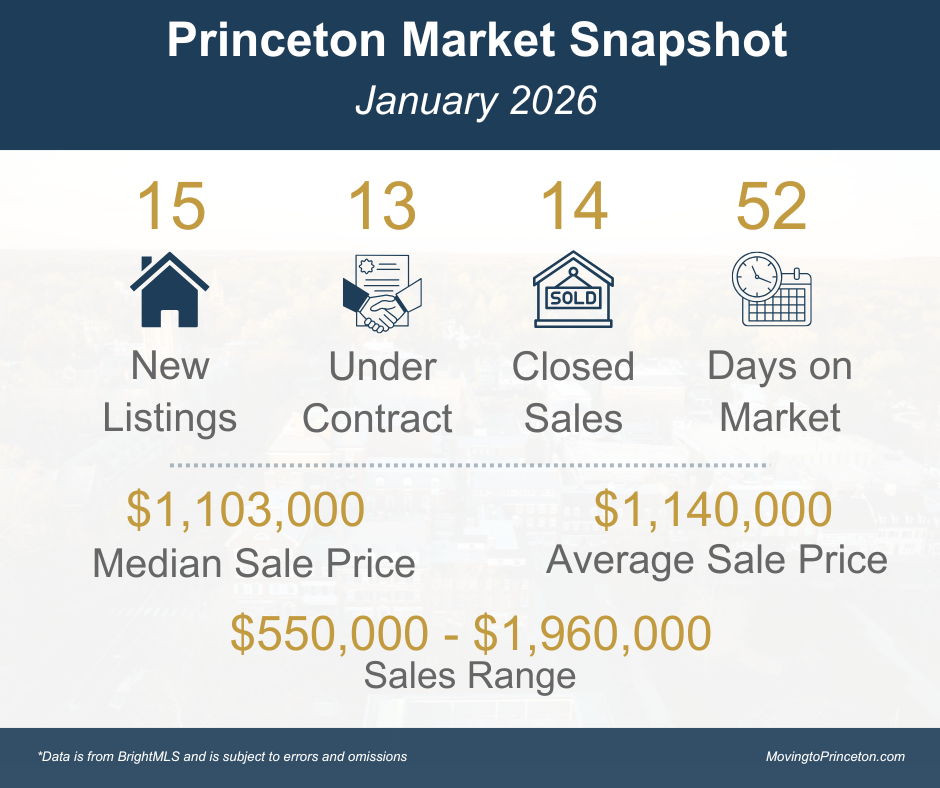
In January 2026, Princeton recorded 15 new listings, 13 properties under contract, and 14 closed sales. Days on Market materially declined to 52 days, down from 79 days last January. The median sale price was $1,103,000, and the average sale price was $1,140,000, with sales ranging from $550,000 to $1,960,000.
Before I dive into the rest of the data, I wanted to share that in the spirit of continuous improvement, I am slightly refining how I present monthly data this year. Rather than showing every year side by side, I am sharing 2019 as a pre-pandemic baseline and pairing it with the most recent three years of data. This approach simplifies the presentation of the data and enables meaningful comparison with a more typical market environment, while maintaining the focus on current market conditions and direction.
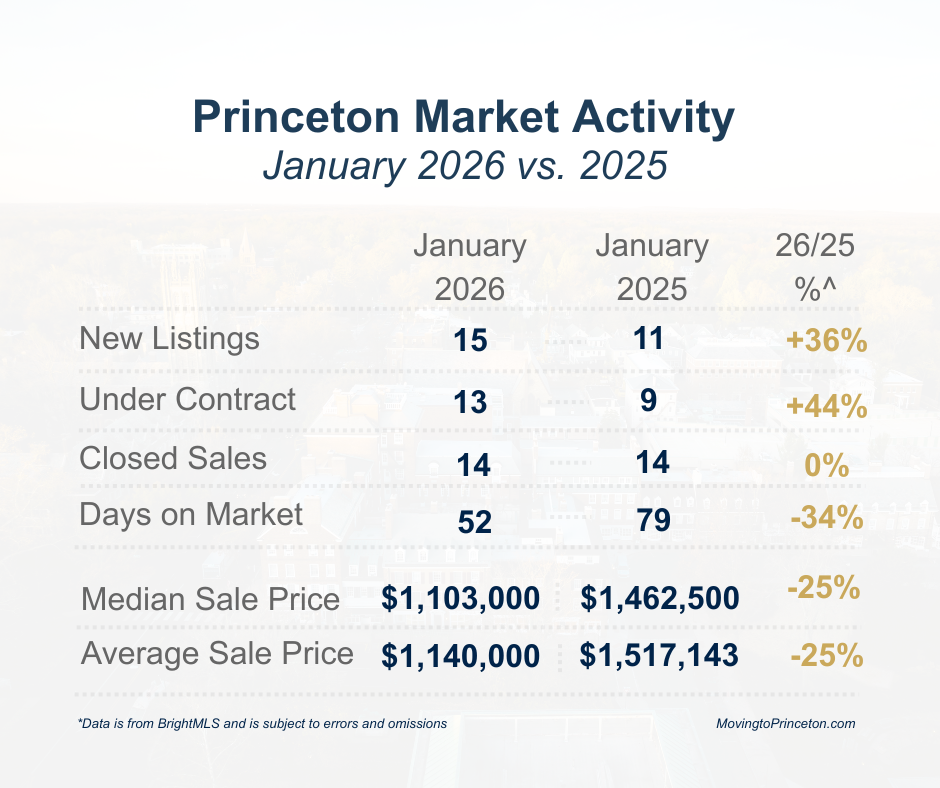
Compared to January 2025, new listings increased by +36%, and under contract properties rose by +44%, while closed sales remained flat. Despite the increase in activity, pricing moderated year-over-year, reflecting a shift in sales composition rather than a broad weakening in demand, which I will explain in more detail later. Homes are moving more efficiently than in January 2025, suggesting buyers remain actively engaged when properties are well priced and strategically prepared.
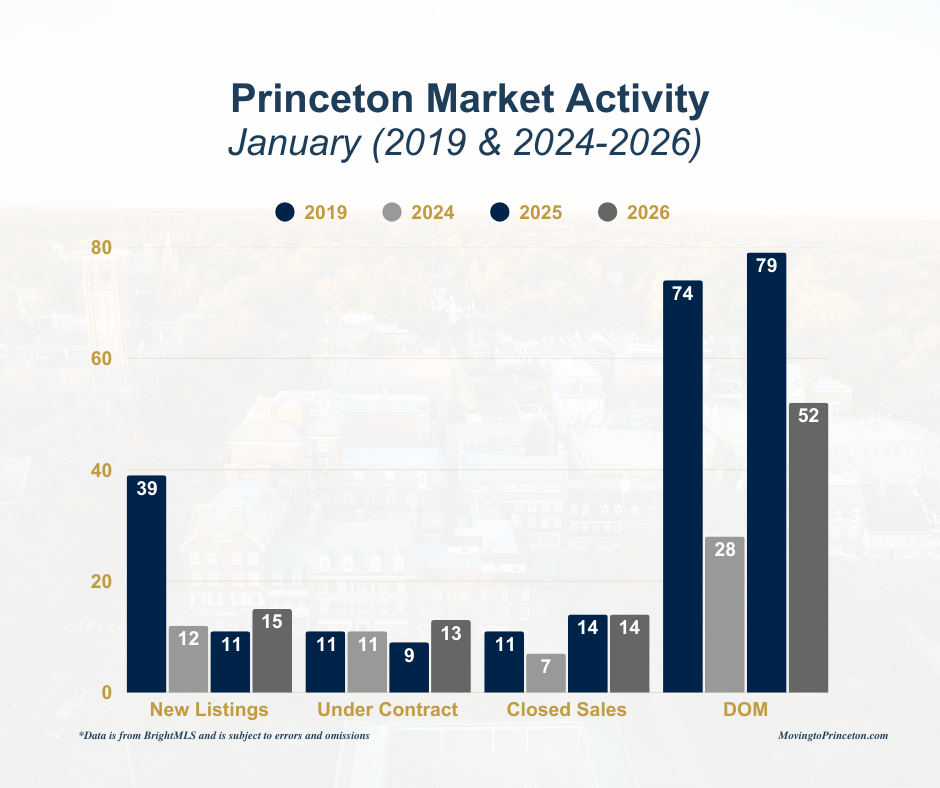
On a broader level, January 2026 activity shows improving momentum relative to recent years, though still well below pre-pandemic norms for new listings, with demand continuing to outpace supply and days on market reflecting a more efficient pace than in prior years.
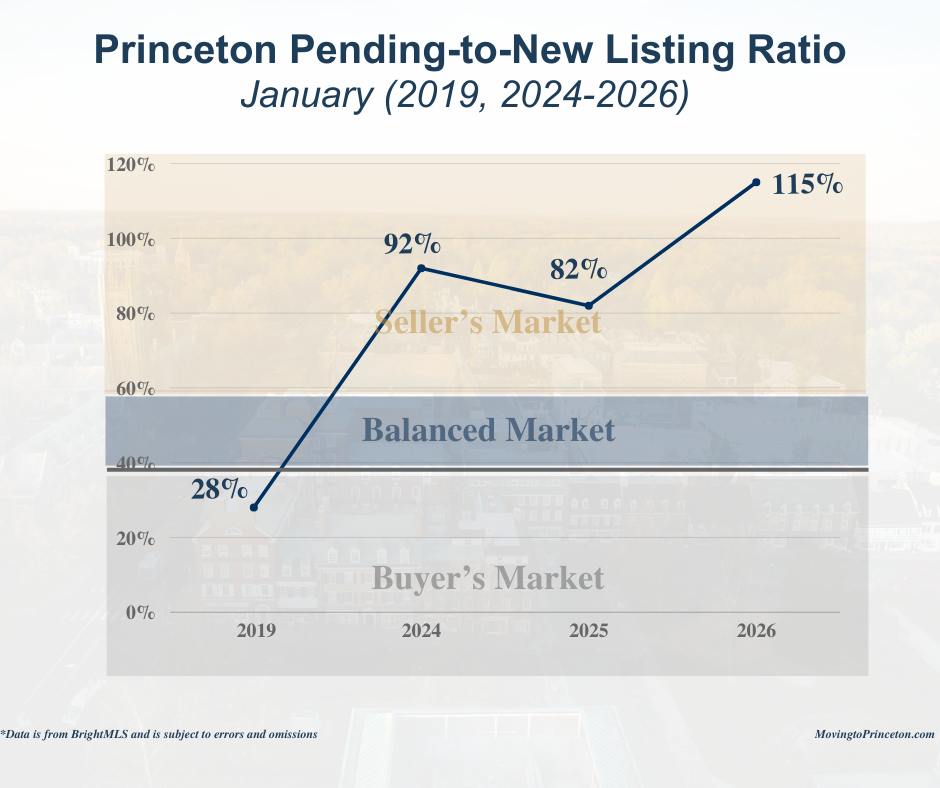
One of the most telling measures of market balance remains the relationship between demand and supply. In January 2026, the pending-to-new listing ratio reached 115%, well above the threshold for a balanced market (typically 40–60%) and far exceeding the 28% recorded in 2019. This data once again demonstrates that buyer demand is absorbing new, well-presented inventory quickly, even as supply shows early signs of improvement.
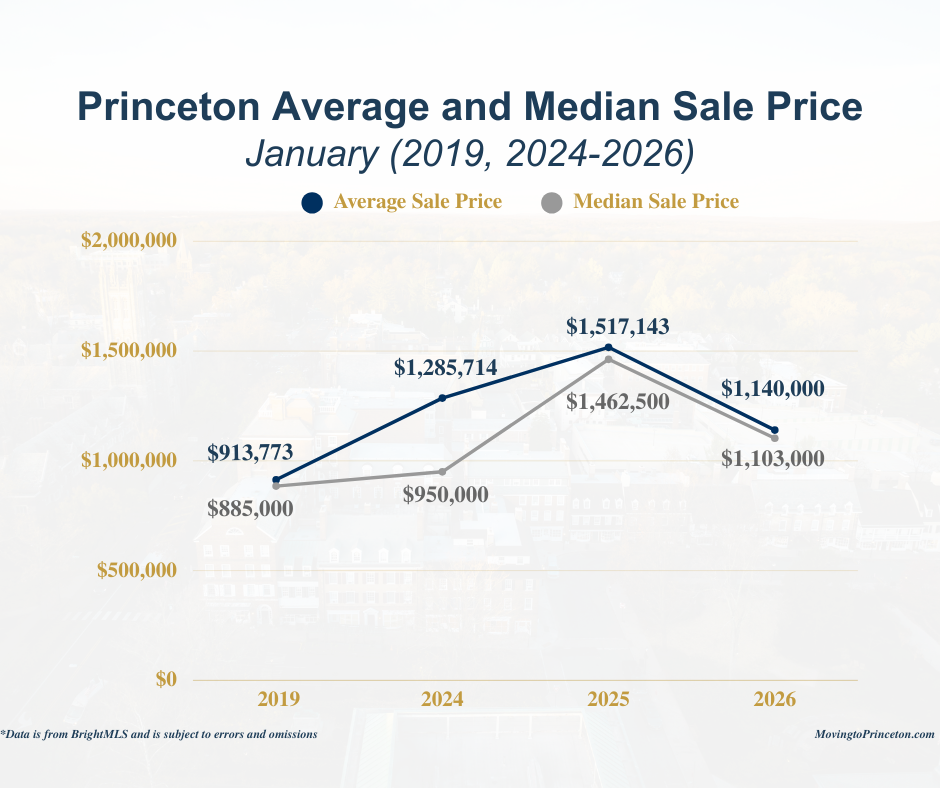
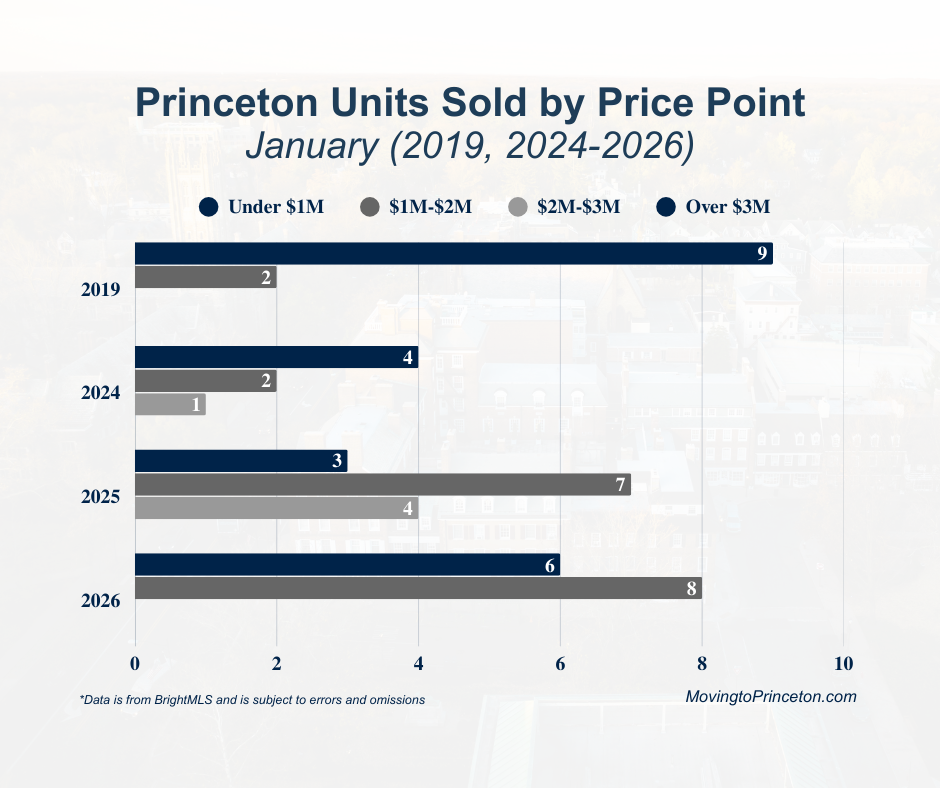
Prices remain well above pre-pandemic levels, though below the January 2025 peak. As noted earlier, changes in the January 2026 sales mix help explain the year-over-year price moderation compared to January 2025. In January 2026, most sales occurred in the under $1M and $1M-$2M price ranges, compared to January 2025, when a greater share of sales occurred in the $1M-$2M and $2M-$3M ranges. Notably, there were no sales in the $2M-$3M price range in January 2026, compared to 4 sales in 2025. The narrowing gap between the average and median sale prices in January 2026 further underscores this shift in sales composition, with fewer high-end outliers.
The January 2026 data points to a market that remains active but supply-constrained, with buyers responding to quality and value rather than urgency alone. As we move further into the year, inventory levels, and especially absorption rates, will be important metrics to watch.
As always, real estate is local and nuanced. These broader trends provide useful context, but every neighborhood and property tells its own story. If you would like to discuss how this data relates to your specific plans or a particular market segment, I am always happy to be a resource.
Please feel free to reach out at any time as I am always here as a resource.
