
The Princeton September 2025 and year-to-date data tell the story of a market in transition that continues to demonstrate strength. Buyers are enjoying a calmer pace that is more typical of the fall season, while sellers who price strategically are still achieving excellent outcomes.
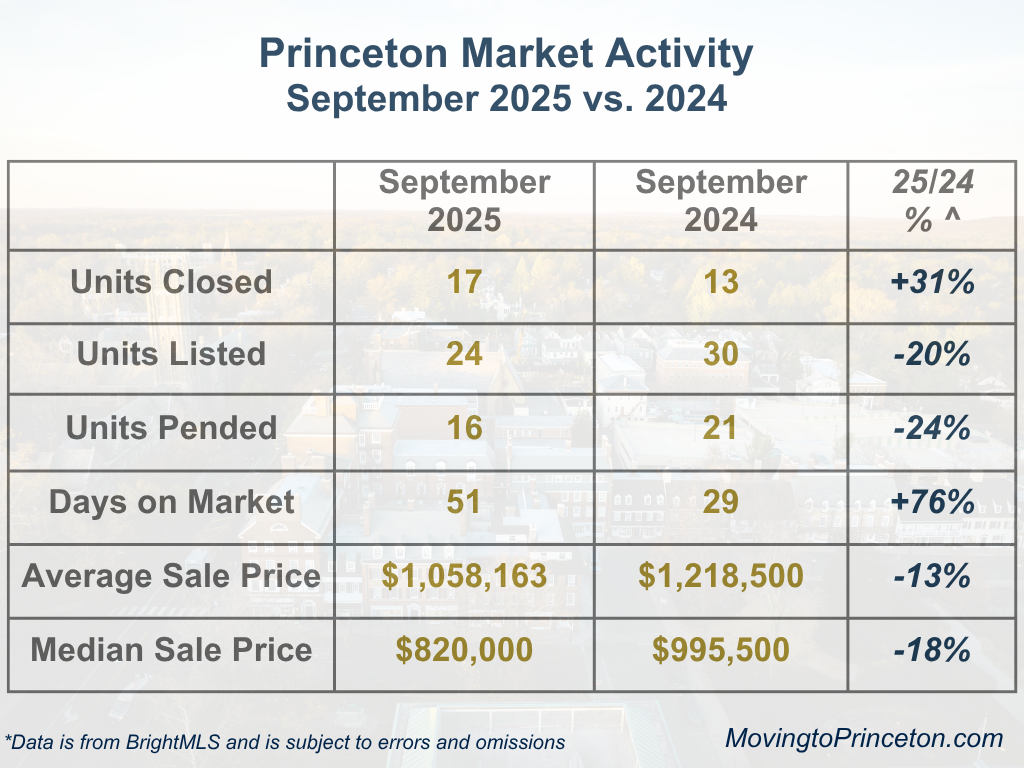
Compared with September 2024, the September 2025 closings increased by 31%, while new listings declined by 20%. Although pendings fell by 24%, the Pending-to-New Listings Ratio of 67% indicates continued buyer engagement in a more balanced market. Properties took longer to sell, averaging 51 Days on Market, up from 29 last year, suggesting that buyers took additional time to evaluate their opportunities. Pricing also moderated in September 2025 with a 13% decline in the Average Sale Price, and the Median Sale Price fell 18% relative to September 2024. This adjustment primarily reflects a shift in the mix of properties sold. Only 47% of the September 2025 sales were detached homes, compared with 69% in September 2024, illustrating that sales composition drove much of the year-over-year change.
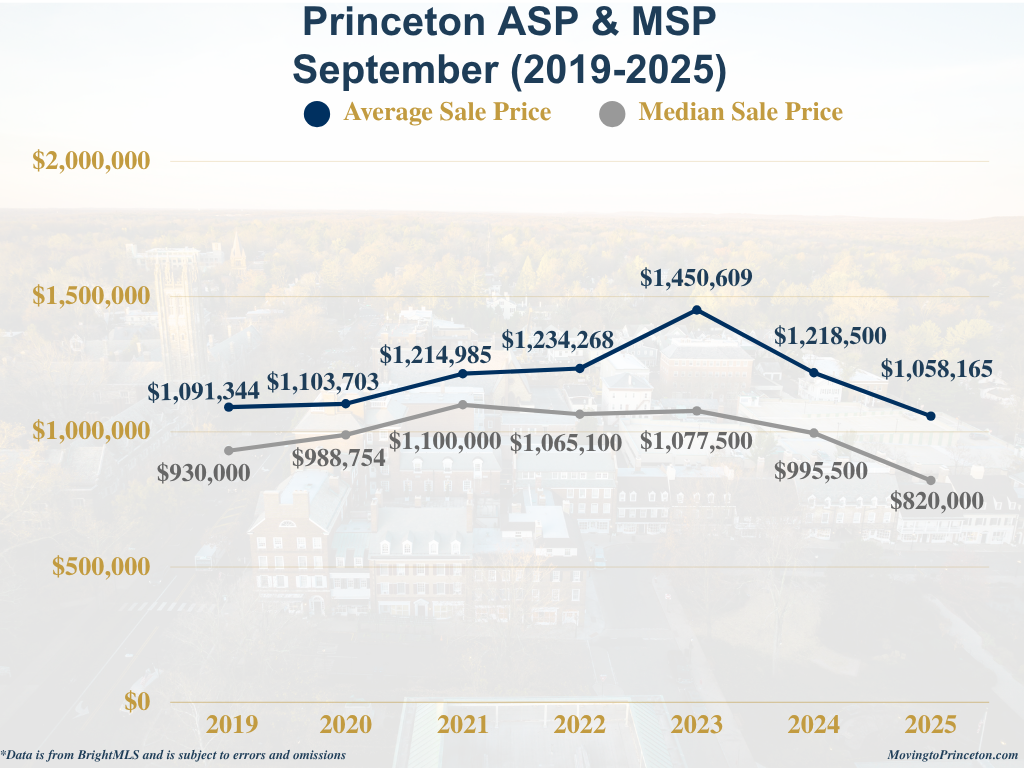
The longer-term September data reveal Princeton’s steady evolution from measured pre-pandemic activity to the rapid acceleration of the pandemic years and now the market normalization underway today. Between 2019 and 2021, the September activity increased sharply due to intense pandemic buyer demand. In September 2022 and 2023, limited inventory and rising rates marked a new phase of tighter supply and record pricing. After a quieter September 2024, September 2025 closings rebounded even with fewer new listings, highlighting the enduring strength and desirability of the Princeton market.


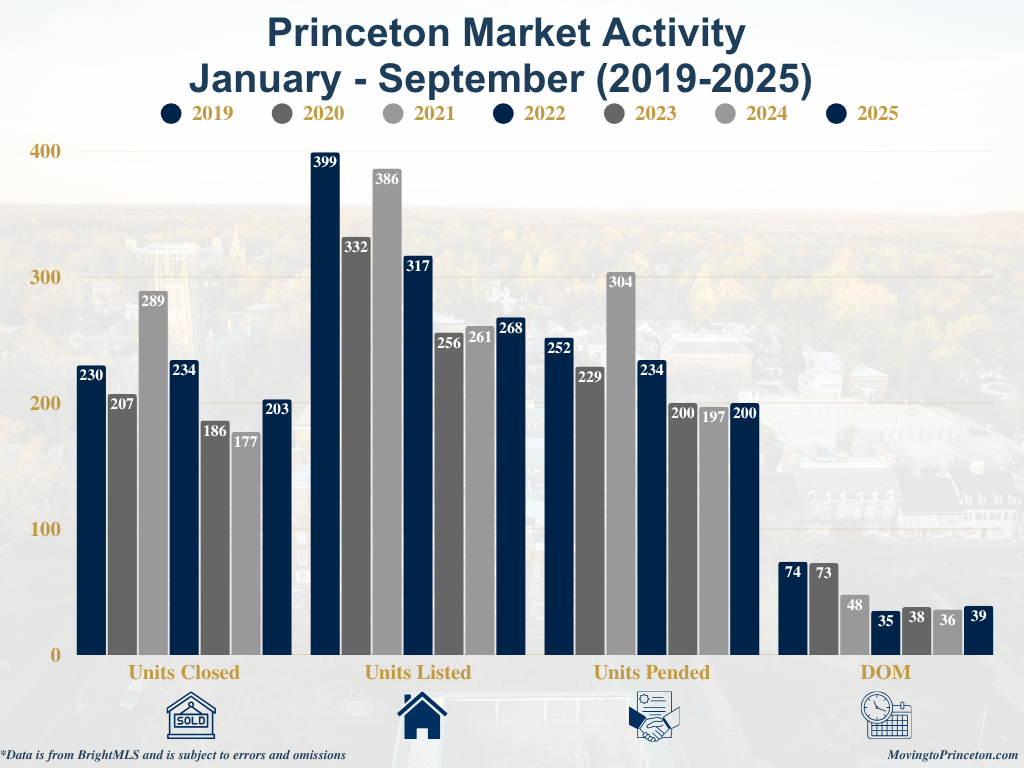
The YTD data further support Princeton’s broader story of resilience. Through September 2025, 203 Units Closed, up from 177 last year, and the strongest total since 2022. New listings (268) remain low, roughly one-third below 2019 levels, keeping the supply tight. The Pending-to-New-Listings Ratio of 75% demonstrates sustained demand, with properties continuing to sell relatively quickly, averaging 39 days on the market, which is nearly half the 2019 average of 74 days.

Both Average and Median Sale Prices have climbed to record highs, reaching $1.62 million and $1.38 million, respectively, which is more than 50% above 2019 levels. This long-term appreciation underscores the structural strength of Princeton’s market with its enduring appeal and consistent demand across price points, especially in the high-end, which is experiencing a record year.

What is going on in the greater Princeton area? Through September 2025, Princeton continued to lead the region in both Average and Median Sale Prices, followed by Montgomery and Cranbury Township. Lawrence Township experienced the most sales at 212, followed by Princeton (203), and Hopewell Township and West Windsor Township tied at 197 Units Sold.


What is happening now in Princeton? There are 64 Active Units between $360,000 and $6,500,000, 13 Active Under Contract Units between $700,000 and $2,975,000, and 11 Pending Units between $699,000 and $2,750,000. Lastly, only 9 new listings have been introduced thus far in October.
As always, real estate is local and nuanced. These broader market trends provide valuable context, but every neighborhood and property tells its own story.
If you are curious about your home’s value or would like a tailored analysis of a specific segment of the market, I would be delighted to provide one. Please feel free to reach out at any time as I am here as a resource.
