

Rather than reiterate the macro headlines highlighting geopolitical risks, inflation, and the rise in interest rates to explain the current state of the Princeton residential real estate market, we are going to explore the data in a way that will hopefully shed some light as to what happened in August and where the market might be headed. On the surface the statistics seem to say one thing, but when you dig a little deeper a new chapter seems to be developing that is worth noting and following.
At this point it is pretty clear that we are in a transitional market and like last month, we thought it would be helpful to share the last four years of August data to include pre-pandemic information for some context and hopefully, a better understanding of the statistics. Let’s start with comparing August 2022 to August 2021 where Units Sold (-24%), Units Pended (-13%), and Days on Market (-16%) all experienced a decrease. Only Units Listed (+13%) increased over the same period last year. In other words, while fewer properties sold in August 2022 compared to August 2021, they sold at a much faster pace. While there were more listings than last August, there were fewer pended sales.
If you look at August 2022 compared to August 2019, only Units Listed increased (+113%). Units Pended were effectively flat (+5%) and Units Sold (-22%) as well as the Days on Market (-62%) both experienced a decrease. While the Units Listed increase seems really high, in pre-pandemic times August was typically a quieter month for new listings and given the current low inventory, our market really needed them. What is also most notable here is just how significant the Days on Market changed – 26 days vs 68 days! So how did this phenomenon affect the Average Sale Price (ASP) and the Median Sale Price (MSP)?
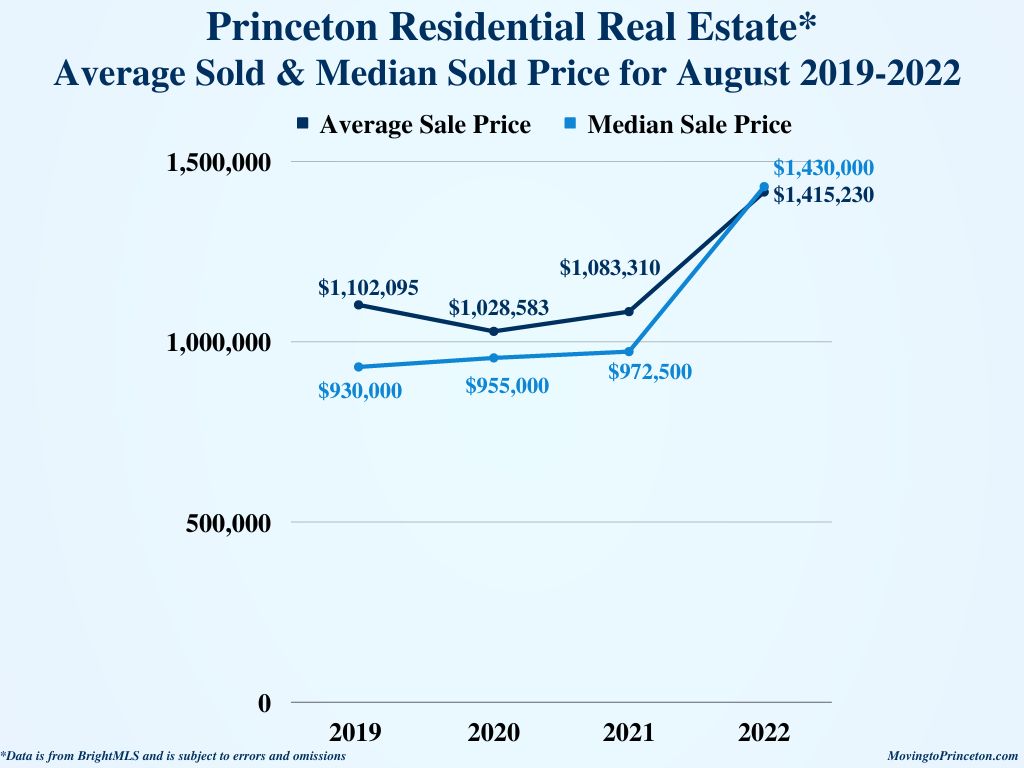
The August 2022 ASP and MSP both experienced a material increase compared to August 2021 (+31% and +47% respectively). At first glance this seems almost unbelievable. To get a better understanding of the data, we analyzed when the contracts were actually negotiated. It turns out that 50% of the properties sold in August were negotiated before July and sold for an average of +3% over their original list price. The 41% of houses that went under contract in July sold on average for almost -4% less than their original asking price. The 9% of the properties that both were negotiated and traded in August 2022, sold for more than – 4% less than their original list price. Is it a coincidence that the data seems to reflect the effects of the FMOC increasing the Fed Funds rate by another 75 basis points around the same time? We don’t think so.

Now let’s take a deeper dive into the sales composition to see what can be learned. As noted by the chart above, the August 2022 sales composition changed dramatically compared to prior years with the lion share of the sales coming from the $1M-$2M price range rather than the under $1M price point. Additionally, the August 2022 $1M-$2M and the +$2M price ranges were the highest across all four years. So between the fast pace of sales and the vastly different sales composition, one could argue both contributed to the August 2022 increase in both the ASP (+31%) and MSP (+47%) compared to August 2021. What was the Average List Price for both August 2022 and August 2021 you might ask? The August 2022 Average List Price (ALP) was $1,413,675 compared to $1,085,281 in August 2021 – that is a +30% increase! Clearly sellers were testing the market with their pricing and buyers were responding accordingly as evidenced by the the August ASP and ALP moving in tandem. As always, it is important to note that there are several sales that take place outside BrightMLS and are not captured in this data.
How is Princeton is performing year-to-date? Units Closed (-16%, 212 vs. 251), Units Listed (-17%, 291 vs. 350), and DOM (-33%, 33 vs. 49) all experienced a decrease compared to January-August 2021. The ASP (+6%, $1,250,684 vs. $1,176,230) and MSP (+10%, $1,100,000 vs. $999,999) both increased over the same period last year. It will be interesting to see if pricing has peaked and whether or not there will be enough new listings this fall to satisfy buyer demand. And while we wish we had the proverbial crystal ball to predict future market trends, what we do know is that a house in our market in a good location and in good condition tends to sell quickly and at a premium. Additionally, with roughly a third of Princeton sales in cash, the higher interest rates may not affect our area as much as other markets.
So what is happening now? There are currently 60 Active Units between $413,000 and $8,500,000, 23 Active Under Contract Units between $624,000 and $12,000,000, and 19 Pending Units between $600,000 and $2,985,000. Lastly, 6 properties were introduced thus far in September and 4 are Coming Soon.
With the summer behind us, we are super curious to see what the fall will bring. Speaking of curiosity, if you are thinking about buying or selling your home or want to learn more about Princeton area real estate market statistics, feel free to email us! Sig & Syl
