
Before we dive into the data for August, we wanted to say that we hope all of you and your loved ones are well and were not too impacted from the recent storms. Please know you can always reach out with any questions and/or if you need any assistance.
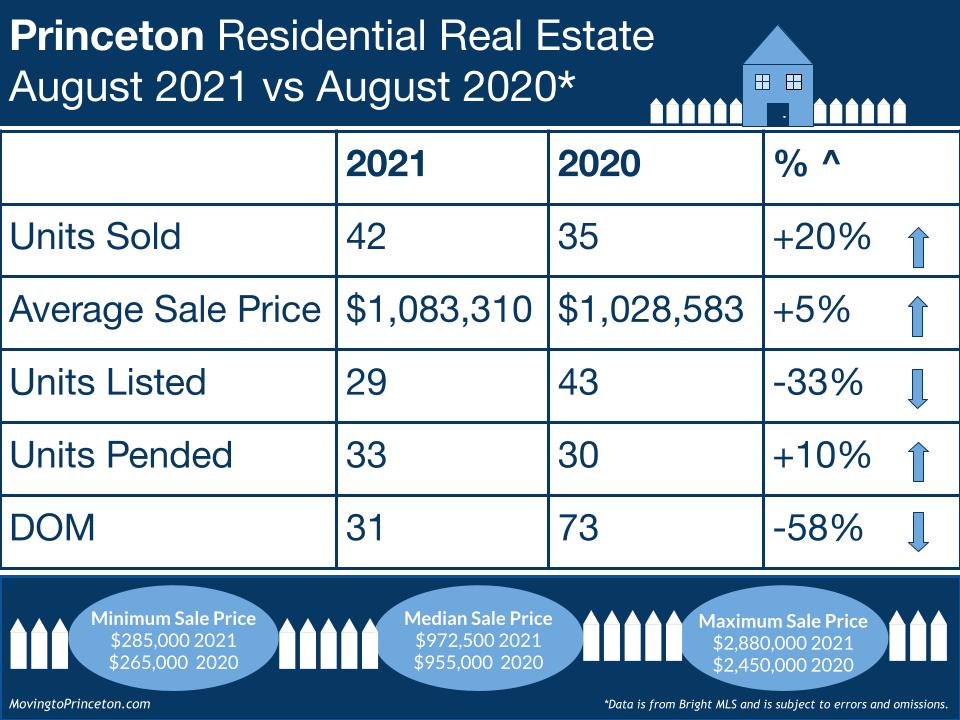
If this year was a book and each month was a chapter, we would use the title Absorption for August. This August, Units Sold increased +20% (42 vs. 35) while Days on Market Units decreased -58% (31 vs. 73) compared to last year. Yes, you read that correctly; it took only 31 days to sell a property in Princeton. And while Units Listed were down (-33%, 29 vs. 43), Units Pended were up (+10%, 33 vs. 30). Once again, given the incredible sales velocity and proliferation of multiple bid situations, it is unsurprising that the Average Sale Price increased (+5%. $1,083,310 vs. $1,028,583) compared to August 2020.
Speaking of the Average Sale Price (ASP), let’s take a deeper dive into the composition of the August 2021 Units Sold compared to the August 2020 Units Sold to see what can be learned.

In August 2021, most of the sales were under $1M with a lower percentage of sales above $1M compared to August 2020. That said, there were 2 more sales in the +$2M range in August 2021 which is in line with how active the +$2M market has been in Princeton year-to-date.
Given we are still comparing apples to oranges since last year we were still feeling the post-lockdown effect, let’s look at August 2021 compared to August 2019:
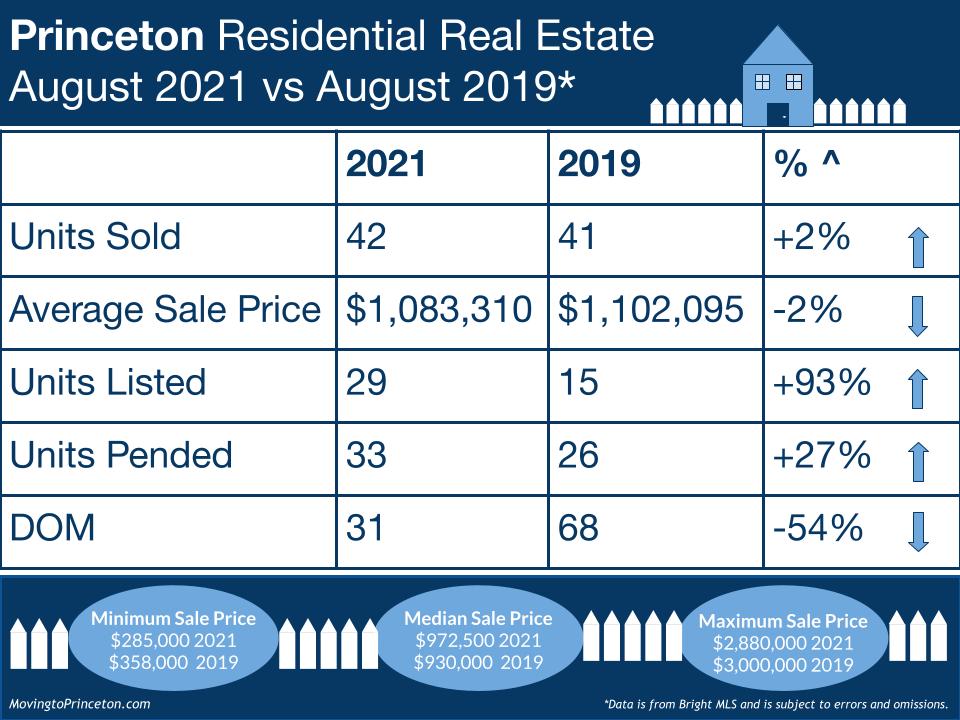
August 2021 looks similar in both Units Sold (+2% 42 vs. 41) and Average Sale Price (-2%, $1,083,310 vs. $1,102,095) to August 2019. Units Listed is materially higher (+93%, 29 vs. 15) as is Units Pended (+27%, 33 vs. 26). The DOM in August 2021 is still significantly lower compared to August 2010 (-54%, 31 vs. 68). Again, the theme here is absorption.
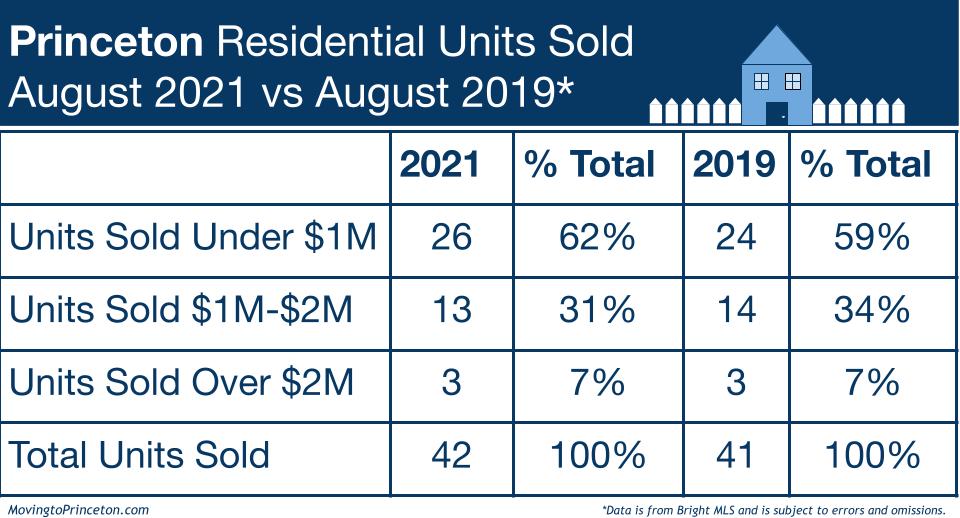
The August 2019 sales-by-price-point was also very similar with August 2021 having almost the exact same sales composition.
How does Princeton look year-to-date? January-August 2021, Units Sold were up (+45%, 251 vs. 173) as were Units Listed (+19%, 350 vs. 293). The ASP was also higher (+15%, $1,176,127 vs. $1,019,914) while DOM decreased materially (-40%, 49 vs. 81) compared to January-August of 2020. Additionally, through August 2021 the minimum sale price was $72,760 compared to $60,500 last year and the maximum sale price was $3,700,000 versus $3,250,000 during the same time last year. In summary, the 2021 year-to-date data shows that properties were selling more quickly, with more Units Listed, than during the same period last year.
If you compare January-August 2021 to January-August 2019, Units Sold were up (+24%, 251 vs. 203) and Units Listed decreased (-2%, 350 vs. 356). The ASP was higher (+14%, $1,176,127 vs. $1,030,692) while DOM decreased significantly (-35%, 49 vs. 75) compared to January-August of 2019. The minimum sale price was $250,000 and the maximum sale price was $3,000,000 during the same period. Lastly, the 2021 year-to-date data shows that properties were selling more quickly, with the same number of Units Listed, compared to the same period in 2019.
So what is happening now? There are currently 82 Active Units on the market between $355,000 and $5,350,000 and 24 properties that are Active Under Contract between $395,000 and $12,000,000. There are also 32 Pending Units between $299,900 and $2,349,000. Lastly, 17 new listings have been introduced thus far in September ($600,000 – $3,500,000) and all are still Active. Given the quick pace of YTD sales, the fact that all of the new listings are still Active does seem to indicate that things might be slowing down a bit. Are buyers waiting to see what new listings come on these next few weeks before making a move? Or is this a sustaining trend? Questions that only time will tell. The good news is that the fall is a shorter selling season so we will know soon the answers to the aforementioned questions.
As always, we are super curious to see what the next few months will bring. Speaking of curious, if you are thinking about buying or selling your home or want to learn more about Princeton area real estate market statistics, feel free to email us! Sig & Syl
