
 |
July’s data tells an interesting story, one you have probably heard and that now can be married with actual data. Let’s start with the basics; Units Sold (-2%, 43 vs. 44) and Units Listed (+5%, 42 vs. 40) in July 2021 were relatively flat compared to July 2020. Units Pended (-27%, 32 vs. 44) were significantly lower as was Days on Market (-49%, 26 vs. 51). Obviously last year was extraordinary and we would argue that Units Pended in 2020 was unusually high – not only because we were coming out of lockdown, but also because of the elevated buyer demand in our area. The 26 Days on Market (DOM) is also noteworthy. Given the incredible sales velocity and proliferation of multiple bid situations, the remarkable increase in the Average Sale Price (+18%. $1,234,520 vs. $1,047,636) is somewhat expected. Speaking of the Average Sale Price (ASP), let’s take a deeper dive into the composition of the July 2021 Units Sold compared to the July 2020 Units Sold to see what can be learned. 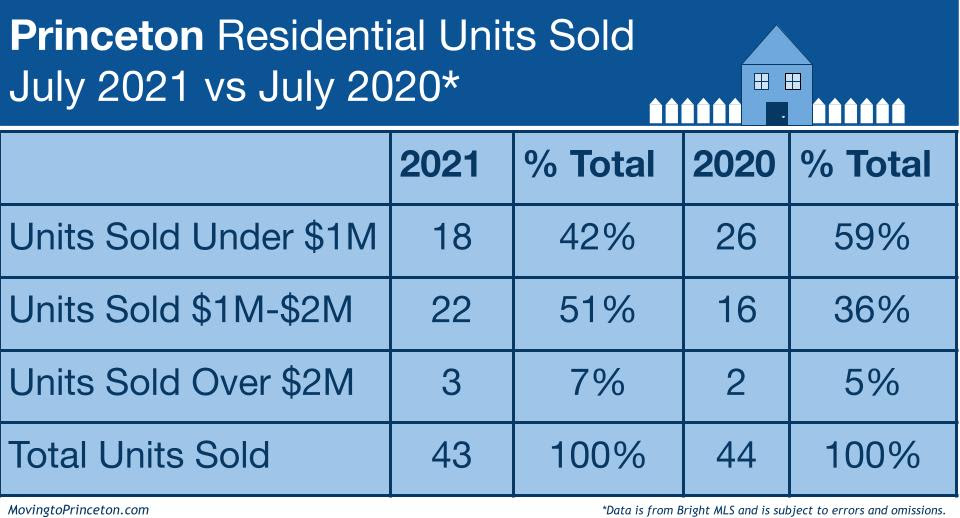 When looking at year-over-year sales, it is interesting to note that while there was a similar number of Units Sold, the sales composition is very different. In July 2021, most of the sales were between $1M-$2M while in July 2020 the majority of sales were under $1M. Now let’s compare July 2021 to July 2019: 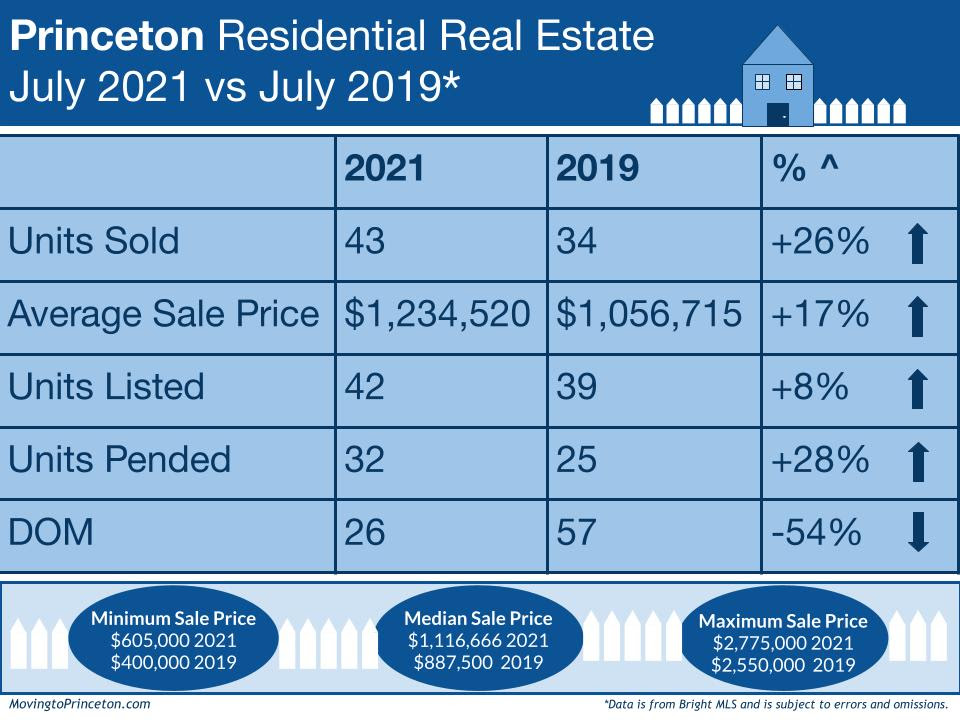 Compared to July 2019, all data points other than DOM experienced a significant increase. The sales-by-price-point shift was similar when comparing July 2021 to July 2019 with both July 2020 and July 2019 having almost the exact same sales composition. 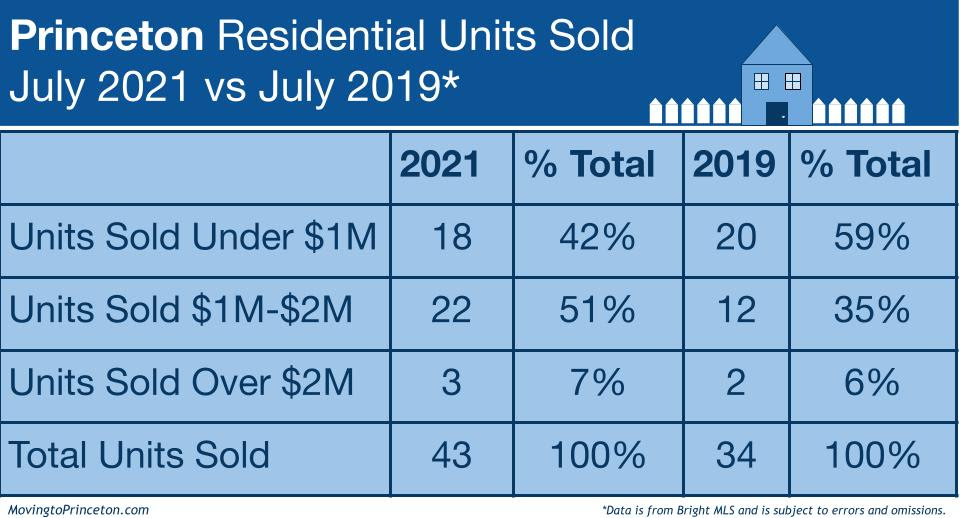 How does Princeton look year-to-date? January-July 2021, Units Sold were up (+51%, 209 vs. 138) as were Units Listed (+28%, 321 vs. 250). The ASP was also higher (+17%, $1,194,555 vs. $1,017,683) while DOM decreased significantly (-37%, 52 vs. 83) compared to January-July of 2020. Additionally, through July 2021 the minimum sale price was $72,760 compared to $60,500 last year and the maximum sale price was $3,700,000 versus $3,250,000 during the same time last year. If you compare January-July 2021 to January-July 2019, Units Sold were up (+29%, 209 vs. 162) and Units Listed decreased (-6%, 321 vs. 341). The ASP was higher (+18%, $1,194,555 vs. $1,012,621) while DOM decreased significantly (-32%, 52 vs. 77) compared to January-July of 2019. The minimum sale price was $250,000 and the maximum sale price was $2,550,000 during the same period. So what is happening now? There are currently 85 Active Units on the market between $355,000 and $5,350,000 and 33 properties that are Active Under Contract between $379,000 and $12,000,000. There are also 33 Pending Units between $525,000 and $2,349,000. Lastly, 16 new listings have been introduced thus far in August ($550,000 – $2,300,000) and all but one are still currently Active. Given the quick pace of YTD sales, the fact that almost all of the new listings are still Active does seem like things might be slowing down a bit. Is this because of the typical summer lull? Or is it a sustaining trend? And will new, post-Labor Day inventory entice buyers? All questions that only in time will we have the answers. While we don’t want to wish away the last couple weeks of summer, we are super curious to see what the fall will bring. Speaking of curious, if you are thinking about buying or selling your home or want to learn more about Princeton area real estate market statistics, feel free to email us! Sig & Syl |
