
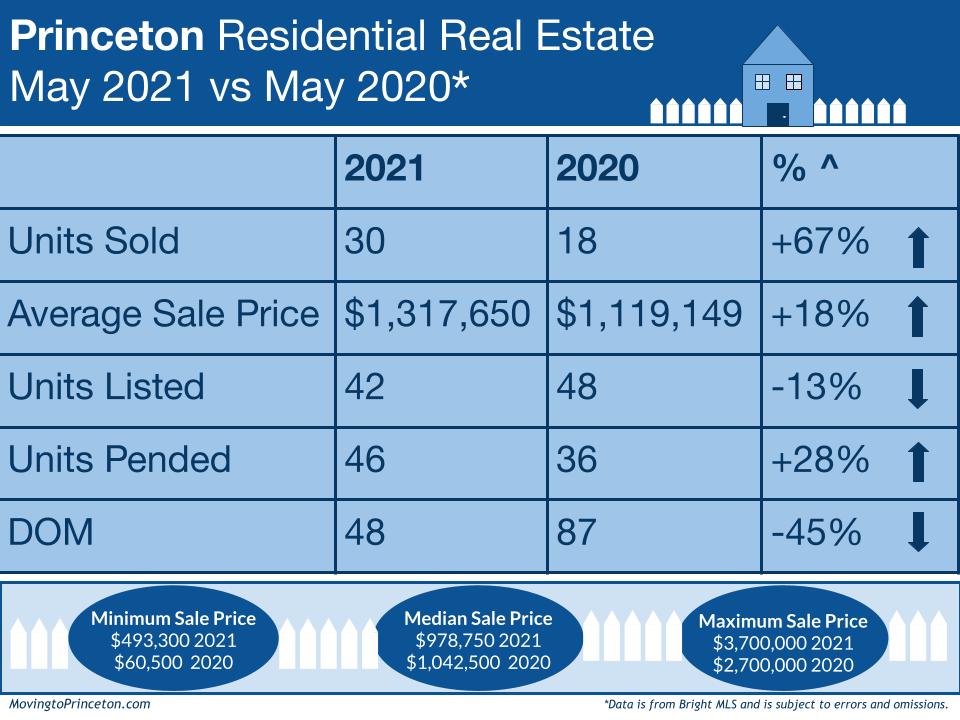
May, just like April, is another month where the data is going to look very wonky for obvious reasons. It’s no surprise when comparing May 2021 to May 2020 extraordinary increases are seen in nearly every metric other than Days on Market (DOM) where we see a significant decrease (-45%, 48 vs. 87) and Units Listed where the decrease is not as substantial (-13%, 42 vs. 48). Therefore, I thought it would be more helpful to compare May 2021 to May 2019 which was a more typical, pre-pandemic May. Before looking at the May 2021 vs. May 2019 data, let’s look a little deeper into the composition of the May 2021 Units Sold compared to the May 2020 Units Sold.
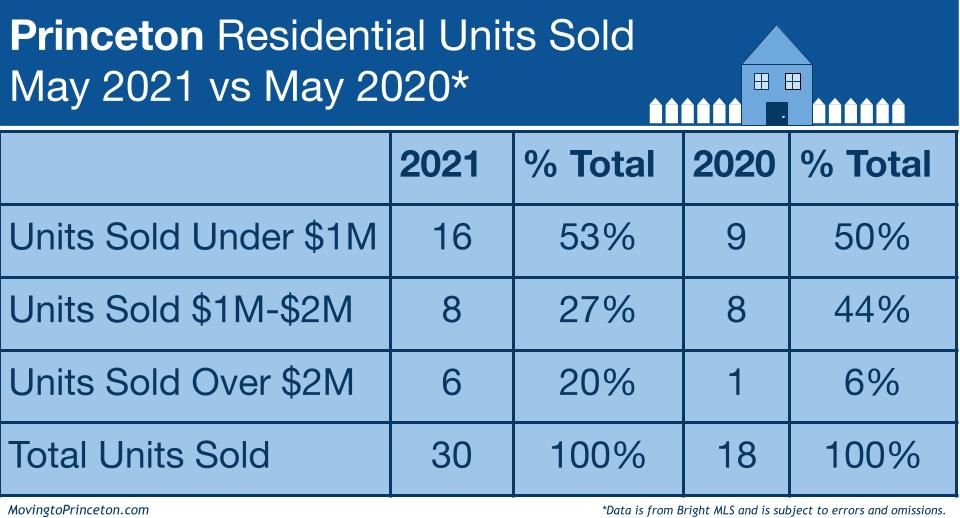
When looking at year-over-year sales composition, it is interesting to note that in May 2021 there were six +$2M sales compared to only one in May 2020 thus skewing the Average Sale Price. Otherwise, the <$1M sales penetration is about the same as is the actual number of Units Sold in the $1M-$2M sales range in May 2021 and May 2020.
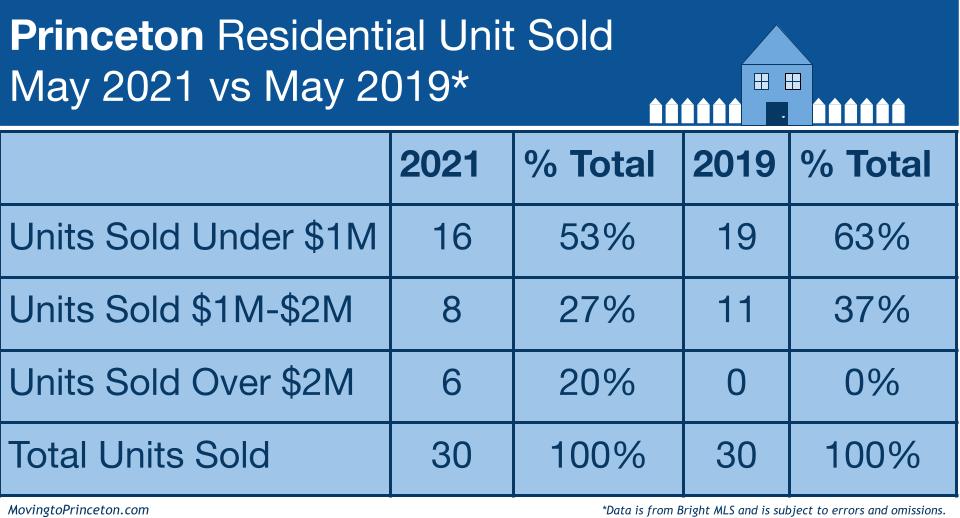
Now let’s compare May 2021 to May 2019:

While In May 2021 the same number of Units Sold as in May 2019, the units were sold at a higher Average Sale Price and at a much faster rate than both in May 2020 and May 2019. Additionally, as noted by the chart below, the May 2021 Units Sold composition was spread across all price ranges with a greater number sales in the +$2M price range. In May 2021 the -26% decrease (42 vs. 57) compared to May 2019 coupled with the low DOM, means the inventory we do have is being absorbed at a much higher rate.
How does Princeton look year-to-date? In January-May 2021, Units Sold were up (+73%, 121 vs. 70) as were Units Listed (+26%, 206 vs. 164). The Average Sale Price was also higher (+18%, $1,172,236 vs. $991,203) while the Days on Market decreased significantly (-44%, 62 vs. 111) compared to January-May of 2020. Additionally, through May 2021 the minimum sale price was $72,760 compared to $60,500 last year and the maximum sale price was $3,700,000 versus $3,250,000 during the same time last year.
So what is happening now? There are currently 84 Active Units on the market between $369,000 and $5,650,000 and 37 properties that are Active Under Contract between $575,000 and $12,000,000. There are also 53 Pending Units between $549,900 and $2,950,000. Lastly, 31 active listings have been introduced thus far in June ($575,000 – $769,000); 3 are already Active Under Contract and 5 are already Pending.
With June behind us, we are super curious to see what the next few months will bring. Speaking of curious, if you are thinking about buying or selling your home or want to learn more about Princeton area real estate market statistics, feel free to email us!
