
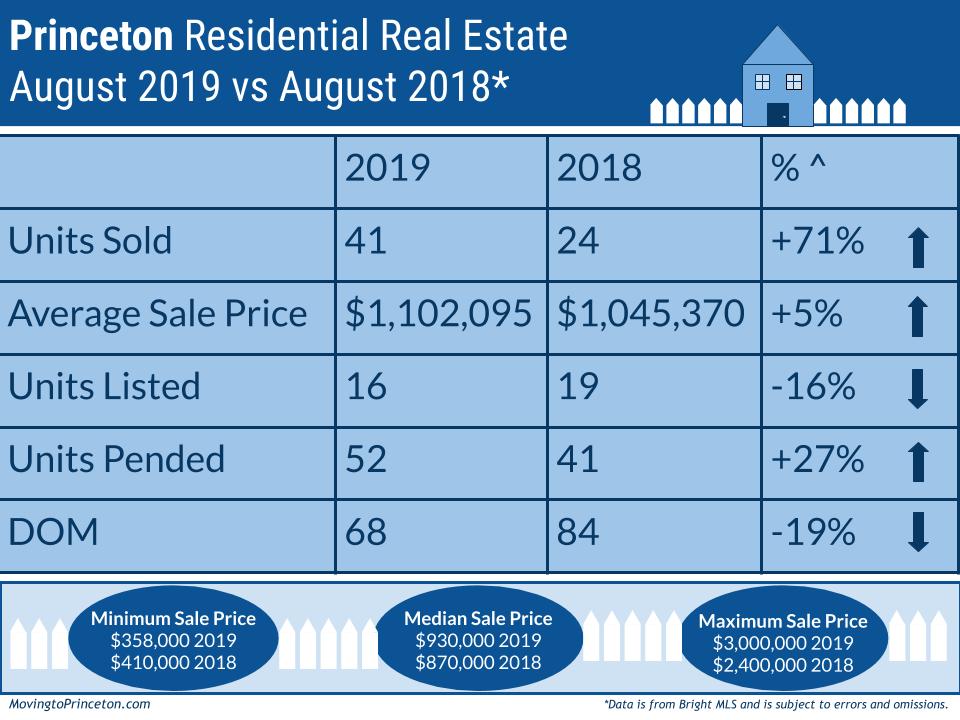
Happy September! While we hate to see the summer end, the fall is one of our favorite seasons. Not only do we welcome the cooler weather, but we also appreciate fall’s gorgeous colors. In the Princeton residential real estate market, September is a month where there is a flurry of activity of both new listings and buyer interest – particularly local buyers. Speaking of activity, let’s take a moment to reflect on Princeton’s August residential real estate market. Last month, more Units Sold at a higher Average Sale Price in a shorter amount of time compared to August 2018. Specifically, Units Sold (+71%, 41 vs. 24), Average Sold Price (+5%, $1,102,095 vs.$1,045,370), and Units Pended (+27%, 52 vs. 41) all experienced an increase over the same period last year. Units Listed (-16%, 16 vs. 19) and Days on Market (-19%, 68 vs. 84) saw a decrease compared to August 2018. How do these statistics compare to the last 10 years? The number of Units Sold, the Average Sale Price, the Median Sale Price, and the Days On Market in August 2019 were all above average (their averages were 38, $1,027,795, $842,655, and 67 respectively). While the number of Units Listed and Units Pended were below average (their averages were 24 and 59 respectively).
Of the 41 Units Sold in August 2019, about the same percentage (59% vs. 58%) of properties (24 vs 14) sold below $1M compared to the same month last year. A slightly lower percentage of houses sold between $1M-$2M (34% vs. 38%) in August 2019 than in August 2018 (14 vs 9). And according to the MLS, in August 2019 3 properties traded over $2M compared to just one in August 2018. Once again, it’s worth noting that last year approximately 9 sales over $2M occurred outside the MLS. This means that throughout the year as we reflect on metrics such as Units Sold, Average Sales Price, and Median Sales Price, the aforementioned sales will not be captured in the MLS data. While it is typical to have a few sales occur outside the MLS, last year was an unusually high number. And in the spirit of looking at things apples-to-apples, we will continue to share Bright MLS data.
How does Princeton look year-to-date through August? Units Sold (+9%, 203 vs 186), Units Listed (+11%, 356 vs. 321), and DOM (+21%, 75 vs 62) all experienced an increase over the same period last year. Both the year-to-date Median Sale Price (+1%, $900,000 vs $891,325) and the Average Sale Price (+6%, $1,030,805 vs $976,108) were also higher than January through August 2018. Lastly, the year-to-date minimum sale price was $250,000 compared to $275,000 during the same period. The maximum sale price through August 2019 was $3,000,000 versus $2,525,000 through August 2018.
So what is happening now? There are currently 132 Active Units on the market between $99,000 and $4,995,000 and 24 properties that are Active Under Contract between $499,900 and $12,000,000. Additionally, there are 28 Pending Units between $32,100 and $2,900,000. Lastly, 37 new listings have been introduced thus far in September between $449,000 and $2,999,000.
With August behind us, we are super curious to see what September will bring. Speaking of curious, if you are thinking about buying or selling your home or want to learn more about Princeton area real estate market statistics, feel free to email us! Sig & Syl
