
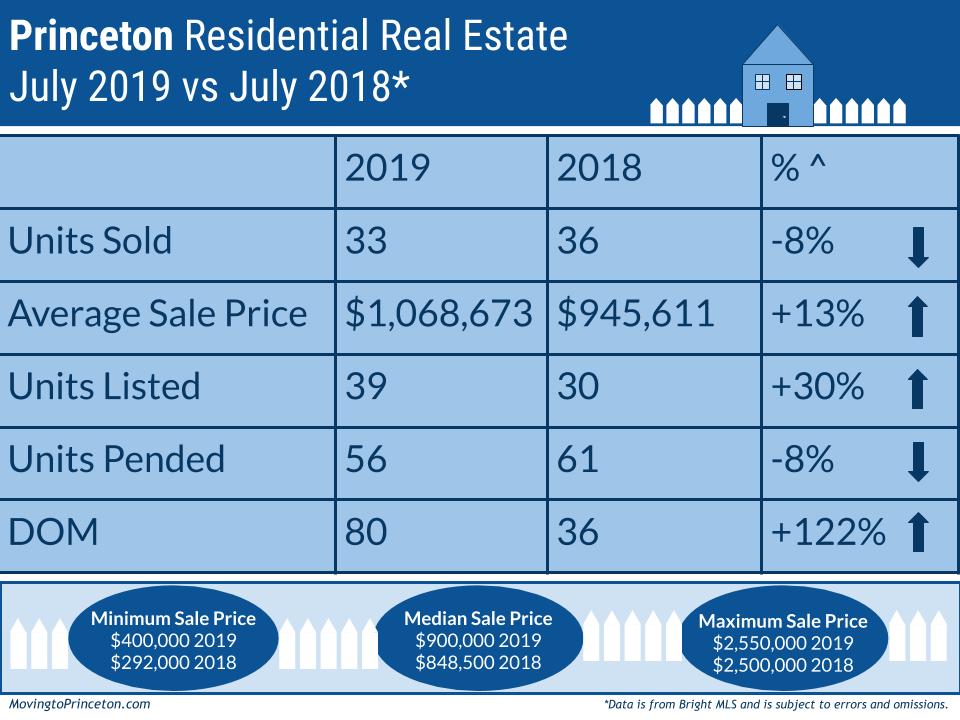
Happy August! In the Princeton residential real estate market, August is a month where a fair amount of closings occur and as such, there is more clarity to what actually happened in the Spring market. This July, much like June, fewer Units Sold at a higher Average Sale Price with longer Days on Market compared to July 2018. Specifically, there was a decrease in Units Sold (-8%, 33 vs. 36) and Units Pended (-8%, 56 vs. 61) over the same period last year. However, the Average Sale Price (+13%, $1,068,673 vs. $945,611), the Units Listed (+30%, 39 vs. 30), and the Days On Market (+122%, 80 vs. 36) experienced an increase compared to July 2018. How do these statistics compare to the last 10 years? The number of Units Listed, the DOM, the Average Sale Price, and the Median Sale Price in July 2019 were all above average (their averages were 32, 63, $1,001,765, and $850,975 respectively). While the number of Units Sold and Units Pended were below average (their averages were 36 and 65 respectively).
Of the 33 Units Sold in July 2019, 59% were below $1M compared to 64% the same month last year. A slightly higher percentage of houses sold between $1M-$2M (35% vs. 33%) in July 2019 than in July 2018. And according to the MLS, in July 2019 two properties traded over $2M compared to just one in July 2018. We might sound like a broken record, but it’s worth noting that last year approximately 9 sales over $2M occurred outside the MLS. This means that throughout the year as we reflect on metrics such as Units Sold, Average Sales Price, and Median Sales Price, the aforementioned sales will not be captured in the MLS data. While it is typical to have a few sales occur outside the MLS, last year was an unusual number. And in the spirit of looking at things apples-to-apples, we will continue to share Bright MLS data.
How does Princeton look year-to-date through July? Units Sold were effectively flat (161 vs. 162) as was the Median Sale Price ($900,000 vs. $896,325). Units Listed (+12%, 343 vs. 305), DOM (+64%, 95 vs. 58), and the ASP (+5%, $1,014,828 vs. $965,847) all experienced an increase over the same period. In summary, year-to-date there has been about the same number of sales at a slightly higher ASP but it has taken longer to sell the units and more properties were listed compared to the same time last year. Lastly, through July 2019 the minimum sale price was $250,000 compared to $275,000 through July 2018. The maximum sale price through July 2019 was $2,550,000 versus $2,525,000 during the same time last year.
So what is happening now? There are currently 147 Active Units on the market between $99,000 and $4,995,000 and 22 properties that are Active Under Contract between $538,750 and $12,000,000. Additionally, there are 36 Pending Units between $425,000 and $2,850,000. Lastly, 5 new listings have been introduced thus far in August between $629,000 and $1,490,000.
With July behind us, we super curious to see what August will bring. Speaking of curious, if you are thinking about buying or selling your home or want to learn more about Princeton area real estate market statistics, feel free to email us! Sig & Syl
