Limited Inventory Leads to Multiple Offers
We hope this finds you and your loved ones healthy and well. With so much going on in the world, and especially in our country, we often struggle with how to begin our monthly data post. Jumping into statistics always feels a bit cold and tone deaf, but one of the many lessons we have learned during these uncertain times is the importance of home and community and we are incredibly grateful for both. Thank you for being a part of our community and for taking the time to our posts.
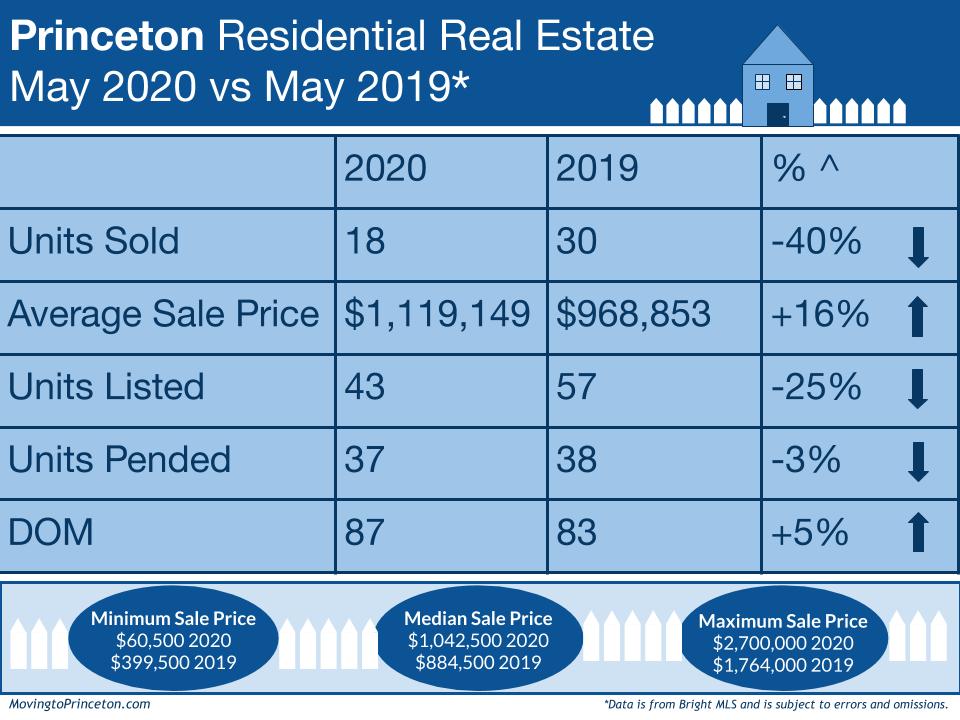
In May, we shared how the effects of the current pandemic were starting to show in the data. Every metric, other than Days On Market (DOM), had experienced a significant decrease. That being said, the idea of fewer listings coupled with historically low interest rates could minimize the downward pressure on pricing. we also noted there was a potential phenomenon that the Princeton area could benefit from and that was the desire of some New York City residents to move to the suburbs; particularly in areas with excellent school systems and access to a train station. Well, May has proven just that. We went from what felt like a buyer’s market to a seller’s market in what felt like a matter of days and the pace has not slowed ever since.
Let’s take a closer look at May’s data. Units Sold were down significantly (-40%, 18 vs. 30) BUT Units Pended were effectively flat (-3%, 37 vs. 38) AND that is with -25% less Units Listed (43 vs. 57). This lack of new inventory is causing multiple offers in certain price ranges and buyers are having to act quickly.

The data above shows that given the sales composition in May 2020 and the higher Median Sale Price (+18%, $1,042,500 vs. $884,500) compared to May 2019, it’s no wonder the Average Sales Price was significantly higher (+16%, $1,119,149 vs. $968,853) this May compared to last May. Not to mention, there was a $2,700,000 sale this May that also greatly skewed the data compared to last May where the highest sale was $1,764,000.
How does Princeton look year-to-date? Units Sold decreased (-22%, 70 vs. 90) as did Units Listed (-38%, 164 vs. 266). Both the Average Sale Price (+4%, $991,203 vs. $949,389) and the Days on Market (+29%, 111 vs. 86) increased compared to January-May of 2019. Additionally, through May the minimum sale price was $60,500 compared to $250,000 last year and the maximum sale price was $3,250,000 versus $2,175,000 during the same time last year.
So what is happening now? There are currently 111 Active Units on the market between $185,000 and $4,950,000 and 29 properties that are Active Under Contract between $499,000 and $12,000,000. Additionally, there are 35 Pending Units between $285,000 and $1,795,000. Lastly, 19 new listings have been introduced thus far in May ($185,000 – $2,00,000).
What’s next? We believe the next couple of months are going to be very telling for several reasons. The NJ stay-at-home order has been lifted and the local economy is starting to open back up. The lack of new inventory may encourage some homeowners who were planning on selling before the pandemic hit to proceed with listing their houses. And if New York City schools decide to stay “virtual” in the fall, buyer competition may increase. Whatever the next few months bring, we are beginning to have more clarity and operate with a little more comfort and confidence.
And once again, rather than signing off with our usual signature, we want to wish you and your loved ones peace and good health. And as always, please feel free to email us with any questions or if you need anything. Sig & Syl
