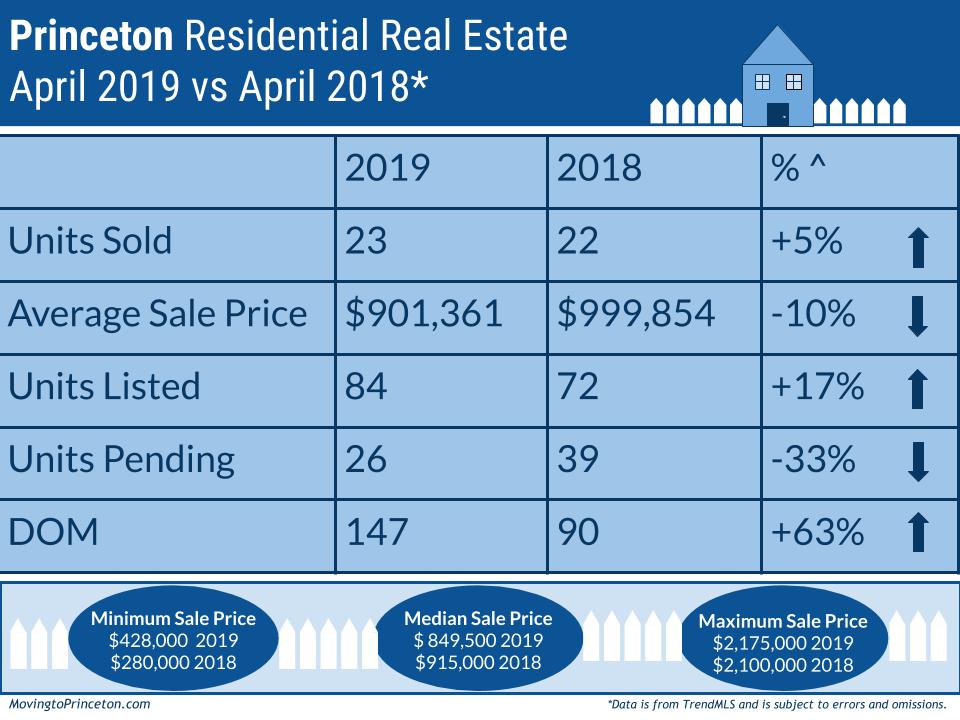

What was April’s story? Just like last month, LISTINGS! There was a +17% increase (84 vs. 72) in Units Listed this April compared to April 2018. In fact, April 2019 experienced the most number of Units Listed in the last 12 years with the next highest, 81, occurring in April 2013. What was the composition of the 84 units listed? 55% (46) of Units Listed was under $1M, 34% (29) was between $1M-$2M, and 11% (9) was above $2M. How does this distribution compare to Units Listed in April 2018? Last April 42% (30) of Units Listed was under $1M, 39% (28) was between $1M-$2M, and 19% (14) was above $2M.
The other interesting chapter of last month’s narrative was UNITS SOLD. Last month Units Sold was up +5% (23 vs. 22). This was the second most Units Sold in the last 12 years with the highest Unit Sold, 28, occurring in April 2013. Of the 23 Units Sold in April 2019, 70% (16) was under $1M, 26% (6) was between $1M-$2M, and 4% (1) was over $2M. How does this distribution relate to Units Sold in April 2018? Last April 50% (11) of Units Sold was under $1M, 41% (9) was between $1M-$2M, 9% (2) was over $2M.
What does this all mean? From the data, one can extrapolate that part of the reason more houses sold under $1M in April 2019 compared to April 2018 was because there were more properties to sell in that price point. Also interesting to note is that while the majority of Units Sold in Princeton are typically under $2M, this April there was a shift to even more Units Sold under $1M as evidenced by the -10% decrease of the Average Sale Price ($901,361 vs. $999,854) and the -7% decrease in the Median Average Sale Price ($849,500 vs. $915,000).
How does Princeton look year-to-date through April? Units Sold was down -3% (58 vs. 60) and the ASP was down -9% ($925,710 vs. $1,016,855). Units Listed (+31%, 213 vs. 163) and DOM (+17%, 139 vs. 119) both experienced an increase over the same period. Additionally, through April the minimum sale price was $250,000 compared to $275,000 last year and the maximum sale price was $2,175,000 versus $2,525,000 during the same time last year.
So what is happening now? There are currently 163 Active Units on the market between $115,000 and $12,000,000 and 32 properties that are Active Under Contract between $450,000-$2,795,000. Additionally, there are 46 Pending Units between $430,000 and $2,450,000. Lastly, 4 new listings have been introduced thus far in April between $599,000 and $3,950,000.
With April behind us, we are super curious to see what May will bring as historically this month experiences the highest number of listings to go under contract. Speaking of curious, if you are thinking about buying or selling your home or want to learn more about Princeton area real estate market statistics, feel free to email us! Sig & Syl
