
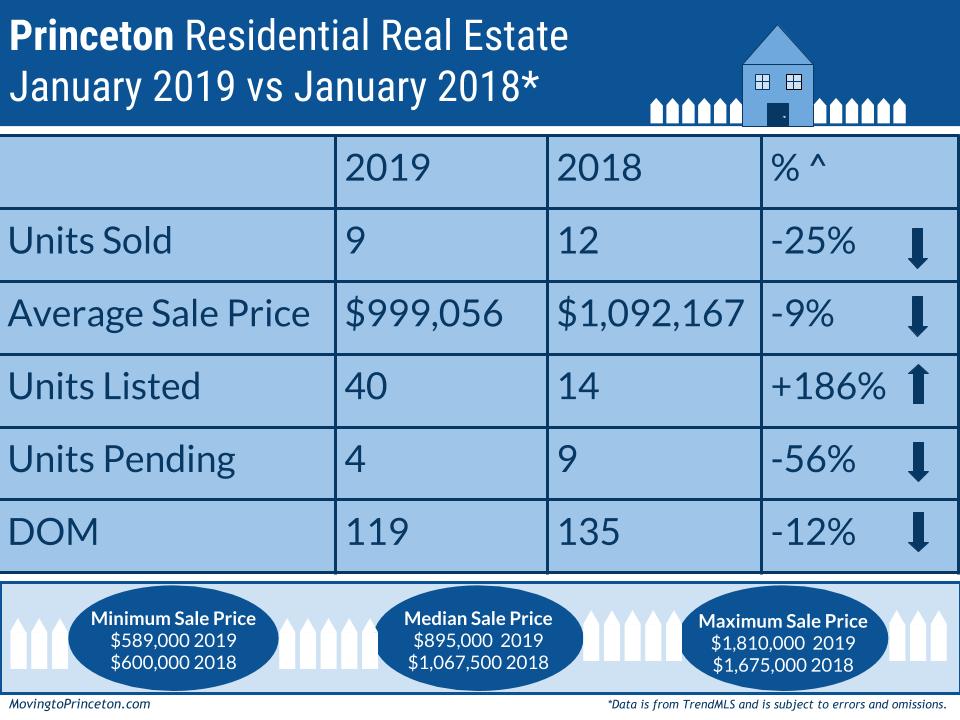
And just like that, it is February! What was January’s residential real estate story? It was all about LISTINGS! January experienced a 186% increase over the same period last year with 40 Units Listed – the highest since 2008 when 46 units were introduced. As you may recall January 2018 was a super quiet month with only 14 new listings. How does January 2019 compare to more recent years? In 2017 there were 22, 2016 had 33, and 2015 experienced 26 Units Listed. What was the composition of new listings in January 2019? Close to 58% of Units Listed were between $1-$2M, 37% were under $1M, and 5% were over $2M.
All other notable statistics experienced a decrease compared to January 2018: Units Sold (-25%, 9 vs. 12), Average Sale Price (-9%, $999,056 vs. $1,092,167), Units Pending (-56%, 4 vs. 9), and Days on Market (-12%, 119 vs. 135). Of the 9 units sold in January 2019, 77% were below $1M, and 22% were between $1M-$2M. Compared to the 12 units sold in January 2018 where 50% of the sales were under $1M, and the other 50% were between $1M-$2M. Some other interesting tidbits of data – the last year there were 9 units sold in January was 2012, and the 4 properties that went pending in January was the lowest number of pending units in the last 12 years.
So what is happening now? There are currently 111 Active Units on the market between $115,000 and $12,000,000 and 9 properties that are Active Under Contract between $425,000-$1,720,000. Additionally, there are 17 Pending Units between $423,888 and $2,495,000. Lastly, 5 new listings have been introduced thus far in February between $1,099,000 and $2,200,000.
With January behind us, we are super curious to see what the next few months will bring. Speaking of curious, if you are thinking about buying or selling your home or want to learn more about Princeton area real estate market statistics, feel free to email us! Sig & Syl
