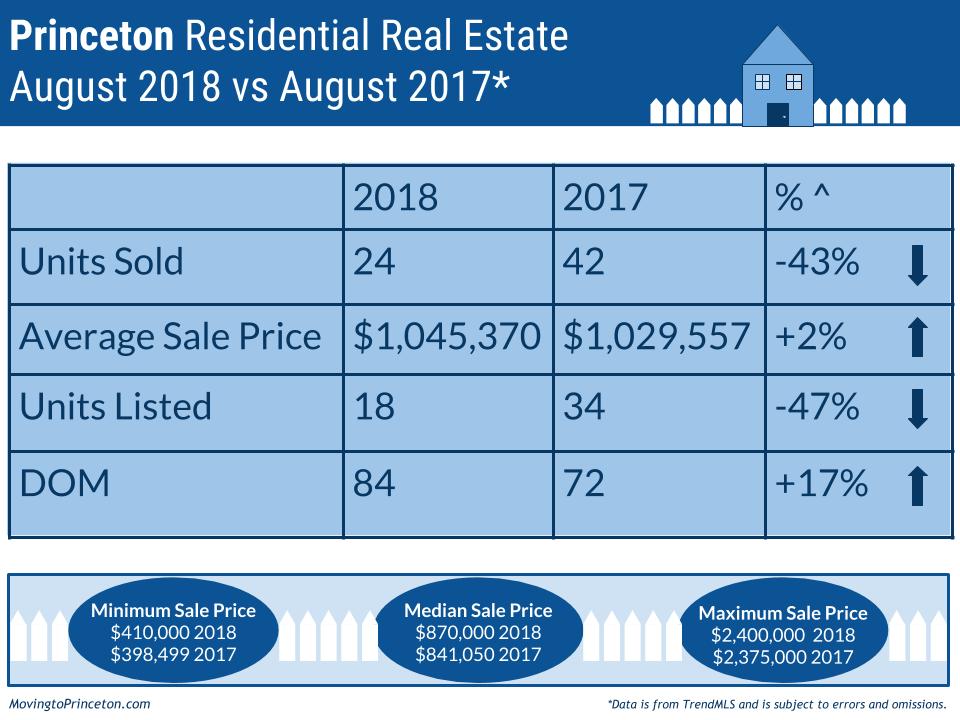

Let’s dive a little deeper into the August data. Of the 24 units sold in August 2018, 14 were below $1M, 9 were between $1M- $2M, and only 1 was above $2M. Compared to August 2017, when 28 units sold below $1M, 11 units sold between $1M- $2M, and 3 units sold above $2M. In August 2018, 97% sales were under $2M versus 93% in August 2017. Additionally 34% of August 2018 sales were between $1M-$2M compared to 29% in August 2017.
How does Princeton look year-to-date? Units Sold are down (-17%, 187 vs. 224) compared to last year as are Units Listed (-5%, 319 vs. 336). The Average Sale Price is down (-6%, $972,600 vs. $1,038,324) while Days on Market increased (+5%, 62 vs. 59). The year-to-date minimum sale price is $275,000 compared to $305,000 last year and the maximum sale price is $2,525,000 versus $3,100,000 during the same time last year. Lastly, year-to-date there have been only 6 over $2M sales in the MLS (as you may recall there were 4, that I know of, outside the MLS) compared to 16 over $2M sales in the MLS over the same period in 2017.
So what is happening now? There are currently 136 Active Units on the market between $280,000 and $12,000,000 – of which 7 are currently under contract. Additionally, there are 29 Pending Units between $275,000 and $2,995,000 and 7 new listings have been introduced thus far in September.
With August behind us, we are super curious to see what September will bring. Speaking of curious, if you are thinking about buying or selling your home or want to learn more about Princeton area real estate market statistics, feel free to email us! Sig & Syl
