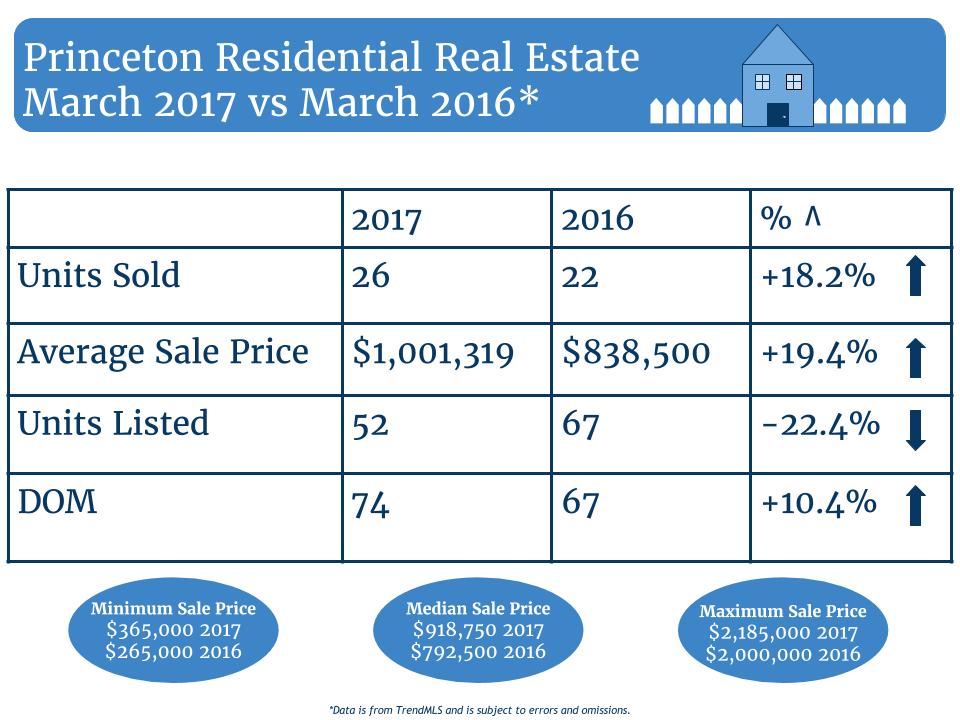

Happy April!!! It’s officially spring and the first quarter is behind us – time sure is flying! March was another busy month in the Princeton residential real estate market. Units Sold increased 18.2% over last year, while Units Listed (UL) decreased -22.4%. The Average Sale Price (ASP) increased 19.4% as did the Days on Market (DOM) which were up 10.4%. How does this information compare to February? Units Sold (US) also increased (45.5%) compared to February of 2016 and US were up 18.9% for the first quarter (Q1) of 2017 compared to Q1 of 2016. As for the Average Sale Price (ASP), February’s 2017 ASP was up 4.8% over the same period in 2016, but experienced an overall decrease of 4.2% if you compare Q1 of 2017 and Q1 of 2016 ($930,046 vs. $970,340) – remember the January number when the ASP was -29.2% compared to January of 2016? It looks like March helped make up some lost ground. Taking a closer look at Units Listed (UL), February’s UL were down -4.7% and down -20.3% for Q1 compared to the same period last year. Speaking of Units Listed, 10 new listings were introduced so far this month and there are a total of 121 active units on the market between $525,000 and $6,900,000.
In summary, March experienced greater spreads in both the ASP, UL, and the Median Sale Price (MSP). Specific to the MSP for March, of 26 units sold 8 of them were in the $1M-$2M range compared to only 5 in 2016. While there are definitely some trends developing, it is still early in the Spring market and we are super curious to see what April will bring. Speaking of curious, if you are thinking about buying or selling your home or want to learn more about Princeton area real estate market statistics, feel free to email or call us! Sig & Syl
